ArcelorMittal Stock Analysis – Is MT a Buy or Sell at the Current Price?
A slowing global economy, declining industrial activities (largely fuelled by lower demand for steel), and sagging steel prices are all negative factors impacting the steel industry today. ArcelorMittal (MT), like its competitors Nucor Corporation (NUE) and United States Steel (X) have suffered on account of these factors.
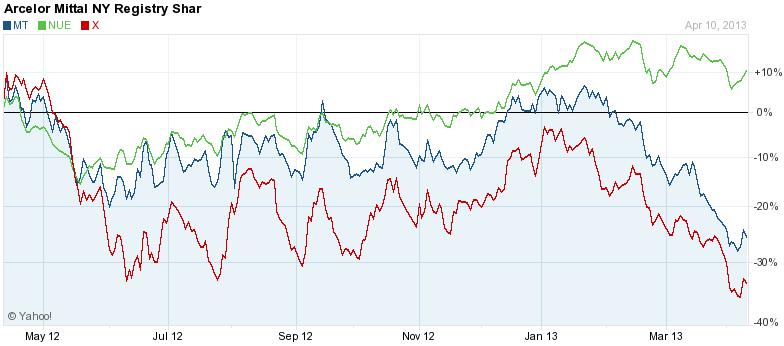
Looking at the stock performance chart above, we can see that, unlike Nucor (NUE), which has been able to turn a corner to the upside, ArcelorMittal and U.S. Steel have both moved in lock-step, trending downward since the beginning of 2013. As such, MT shareholders are right to wonder what the future holds for the stock, and whether they should hold on to their positions, sell or buy more of MT stock.
Let's review the fundamental and valuation picture for MT that might help answer these questions.
ArcelorMittal (MT) Stock Valuation Analysis and Value Proposition
- ArcelorMittal (MT) Fundamental Analysis
- MT’s Valuation Overview
- Technical Perspective – ArcelorMittal Stock
- Favorable/Negative Catalysts for the Stock
- Bottom Line Conclusion
- ArcelorMittal (MT) Fundamental Analysis
For the fiscal year ended Dec 31, 2012, MT reported an Operating Loss of $3.23B, its first since 2009, which was 90% lower than the Operating Income of $4.89B reported in 2011. Sales revenue was down by over 10%, from $93.97B in 2011 to $84.21B for 2012. Sales declined in each of its 6 reporting segments, with Flat Carbon Europe declining the most with a 12.45% reduction from $31.06B in 2011 to $27.19B. This segment of MT's operations was also the biggest contributor to its Operating loss, which amounted to ($3.72B) – up from a loss of $324M in 2011.
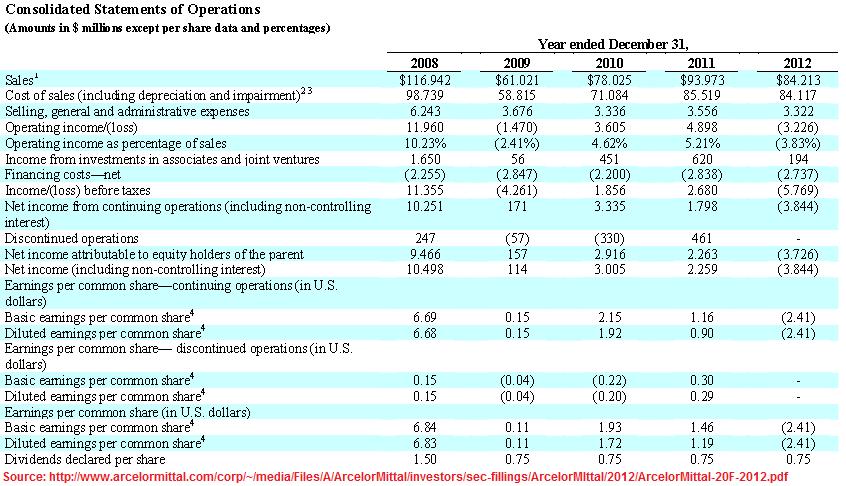
While 2011 saw the company generate a healthy 5.21% (as a percentage to sales) in income, 2012 saw a 3.83% loss as a percentage to sales. As far as shareholders were concerned, the year was a colossal disappointment, earning them a loss of $2.41 per common share, compared to earnings of $1.16 last year.
Ironically, after delivering three consecutive quarters of down-side earnings surprises, Analysts had pegged Q4-2012 to produce a loss of $2.78 per share. With a reported loss of (only) $2.41/share, MT surprised the analysts by delivering 13.30% better results than expected!
(Other News: Will Intel Corp (INTC) Thrive in a Fading PC World? INTC Stock Analysis)
Shareholders were still rewarded with a $0.75 per share dividend, which would have to come from the company's Retained Earnings. Another bright spot of these results was the somewhat optimistic outlook for 2013 presented by management. They expect to deliver much better operating results next year, largely on the expectation of a 2% to 3% increase in the volume of steel shipments, a 20% increase in shipments of iron ore, and approximately $300M-$400M in cost cutting/saving and operational optimizations.
- MT’s Valuation Overview
MT currently trades at a current P/E valuation of -5.2x, which is higher than the Industry valuation of -16.8x, but significantly discounted against the 16.6x valuation of the S&P 500. On a Price/Book, Price/Sales and Price/Cash Flow (P/CF) valuation, MT trades at a discount to both the Industry as well as the S&P 500.
(Read More: AMD Stock is Up 23% in 3 Months – Is AMD a Buy, Sell or Hold in 2013?)
On a competitor valuation basis, NUE trades at a much higher P/E multiple (28.5x) than MT, while its P/B, P/S and P/CF multiples are also comparatively higher as well. On the other hand, U.S. Steel has a much lower P/E valuation (-20.7x) than MT, and also has lower P/S (0.1x) and P/CF (2.3x) multiples. U.S. Steel’s P/B valuation (0.7x) is slightly higher than MT's 0.4x.
On a Forward P/E basis too, MT's 8.4x valuation is much lower than NUE's 12.6x, but slightly higher than U.S. Steel's 6.3x.
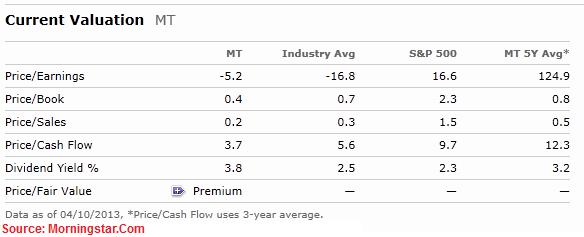
While MT is a relatively cheap stock when compared against the Industry and the S&P 500 on most valuation metrics, it also provides investors a much higher dividend yield of 3.8%, compared to the 2.5% and 2.3% of the Industry and the S&P 500. Currently, neither of its 2 competitors, NUE (3.3%) and X (1.1%), have a comparable dividend yield.
(See Also: Five Stocks Set to Soar (DISCA, KKD, WNR, ATO, DDD) – Buy in 2013?)
- Technical Perspective – ArcelorMittal Stock
Since late March 2013, ArcelorMittal’s Stock has shown signs of a classic Death Cross, where short-term SMA's fall below their long-term counterparts, signalling a falling stock price. The stock has been on a steep decline, falling over 31%, from $17.75 on Jan 25th to $12.23 on Apr 8th.
The stock does not seem to hold on to support at any of its SMA's, and after breaking through its 50-day, 100-day and 200-day SMA in late Feb, seems to be in a free fall. From a shorter-term perspective, while trading within a price range of $11.87 and $15.26, MT has seen a -16.02% Rate Of Change (ROC) in its stock price in the past 30 days, confirming that it has experienced more down-side than up.
Unless the stock demonstrates its ability to hold on to, and press forward with, the gains it has seen in recent trading sessions, investors would be well advised to stay on the sidelines with MT.
Continue: Why ArcelorMittal (MT) Rates as a HOLD. Favorable | Negative Catalysts
Good luck in your investing. Let us know if you have any questions, comments or feedback,
MarketConsensus Stock Analysis Team
Stay in Touch:
Facebook (Like Us on Facebook)
Google + (Connect with Us on Google+)
Twitter (Follow Us on Twitter)
Contact Us (Questions/Comments)
————————————————————————————————-
[related2][/related2]
(By: Monty R. – MarketConsensus News Contributor)