Car Sales Increase – Is Ford Stock (F) a Good Buy, Sell or Hold?
Based on early Jan 2012 statistics from auto industry analysis firm Polk, the average age of the 240+ million cars and trucks on the road in the US is now between 10 and 11 years. The firm estimates that the oldest vehicles on the roads today are SUVs and pickup vans – both of which represent a major business line for Ford Motor Co. (NYSE: F).
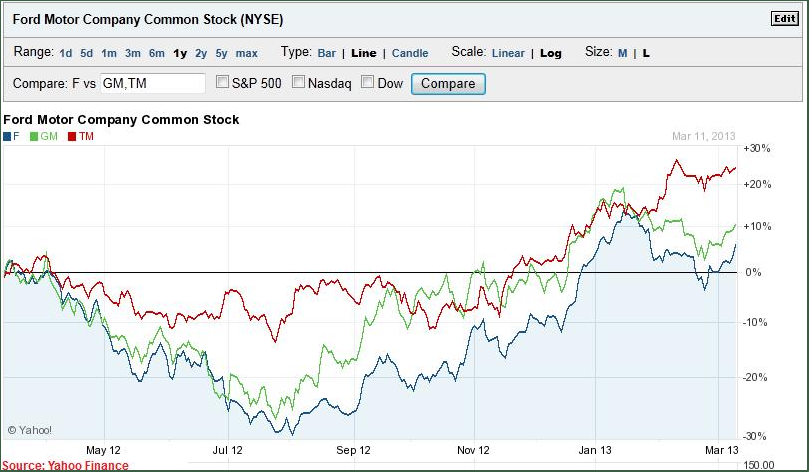
Based on the chart above, it would appear that Ford motor's stock price and that of its competitor General Motors (NYSE: GM) are moving almost in lock step. Ford's other rival Toyota Motor Corp. (NYSE: TM) on the other hand follows an almost similar pattern of rises and falls, but appears to be leading the race to the top.
Given the fact that automobile sales are appearing to pick up in the world's largest auto market, the U.S., investors are curious to know whether Ford stock (F) represents a buy, hold or sell value proposition for them.
Let’s analyze some of the facts that make Ford Motor Co. what it is today.
Ford Motor Co. (NYSE: F) Analysis Breakdown
- Fundamental Analysis
- Valuation Overview
- Technical Perspective
- Favorable Catalysts for the Stock
- Bottom Line Conclusion
- Market Correction Impact
- Fundamental Analysis
Overall, F's Q4-2012 results compared extremely favorably against every metrics on a Y/Y basis when compared to same-quarter last year. The company not only exceeded in number of units sold (up by 8.95%) and revenue earned (up by 12.76%), but more importantly Q4-2012 Pre-Tax results were up by over 110% and Operating margins were nearly double those reported in Q4-2011.
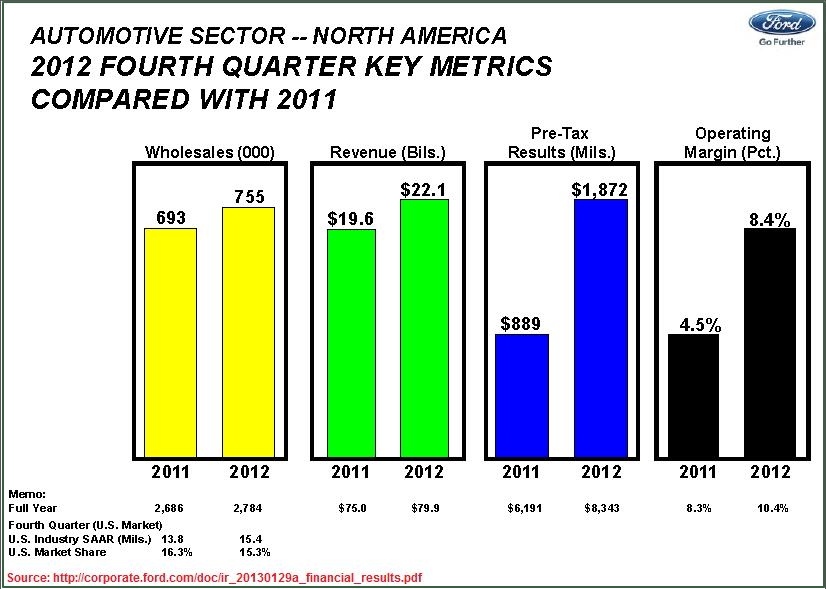
Clearly though, the up-beat sentiment of Q4-2012 was not fully reflected in the company's full-year (2012) results on a year-over-basis. While vehicle sales for 2012 were higher than last year, they climbed by a mere 3.65%. Similarly, 2012 revenues were only up by 6.53% from last year, while the company only saw a 25.30% improvement in its 2012 Operating Margins over 2011. Of concern however is the fact that, while the U.S. Auto industry saw a 11.59% expansion (as measured by the Seasonally Adjusted Annualized Selling rate (SAAR)) from 2011, Ford's U.S. market share actually declined by over 6%. It is hoped that the company will be able to recover these losses in the coming quarters.
All in all, given the state of the global economy, and especially the tentative consumer situation in the U.S., the company did relatively well.
- Valuation Overview
At the time of this analysis, F is trading at a Trailing P/E multiple of 9.36x, compared to a T/PE of 9.73x for GM and 16.73x for TM. On this metrics therefore, we would surmise that both F and GM are trading at a discount to the Industry valuation of 13.8x, while TM is comparatively a significantly overvalued stock. On a Forward P/E basis, both F and GM (7.92x and 6.53x) could be said to be valued fairly close to each other. However, at 13.27x, TM seems to be comparatively overvalued against its 2 competitors.
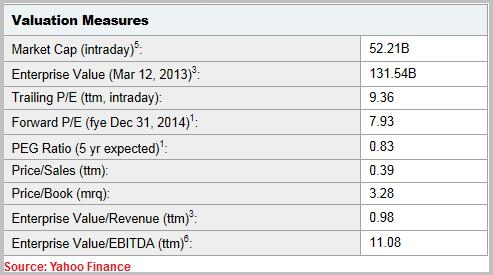
On a TTM Price/Sales basis, both F and GM are valued significantly lower than the Morningstar Industry average of 0.5x (at 0.39x and 0.29x respectively). However, F is certainly trading at a significant discount compared to TM (with a TTM P/S valuation of 0.59x).
Most investors would however be interested in some forward-looking valuation metrics to guide them in an investment decision. The 5-year Expected PEG ratio provides just such a measure. At 0.83, F's PEG ratio is significantly higher than GM's (0.51) or TM's (0.38), making it a stock that is trading at a significant premium to its competitors on a future earnings growth basis.
- Technical Perspective
At the time of this analysis, F is trading at $13.30 which, according to Morningstar data, is very close to the upper end of its 52-week trading range of $8.82-$14.30. From a purely technical stand point, the stock has exhibited some good moves over the last 6 months. After performing several Death Cross maneuvers (where the short-term moving averages of a stock's price fall below the longer-term averages) in the early part of 2012, the stock has gained upward momentum since Oct 2012 to not only recover lost ground, but to also move to new highs.
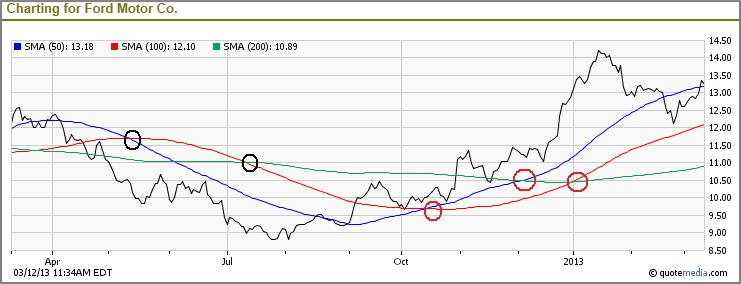
Since mid October 2012, and the early part of 2013, the stock has marked several technical patterns called the Golden Cross (a reversal of the Death Cross move, causing short-term averages to rise above long-term averages). In the last few trading sessions, the stock now seems to be finding support at its 50-day Simple Moving Average (SMA) of $13.18, which bodes well for future upward price momentum.
- Favorable Catalysts
The aging fleet of cars and trucks on the world's roads today, especially those in America, bodes well for Ford's future growth plans. Sooner or later, vehicle owners will have to consider replacing their old vehicles in exchange for newer ones. And when that happens, Ford should be in a good position to snap up a significant portion of that pent up demand.
However, interest rates may prove to be a catalyst to a vehicle owners decision on whether to purchase a car immediately, or whether to further defer such purchases. If interest rates remain at their current near-zero levels, then more owners of old and aging vehicles are likely to finance their car purchases in the near future. However, even the slightest hint that interest rates are on the rise would dampen F's hopes of capitalizing on the aging fleet opportunity, since consumers will likely think twice before making an immediate vehicle purchase decision.
One major catalyst to watch for is the impact that the increase in U.S. Payroll Taxes might have on consumer discretionary spending habits. While it is too early to determine whether consumers will hold back spending on items such as replacing their aging automobiles, any such impact will translate directly into slower growth for major auto manufacturers, including F.
- Bottom Line Conclusion
Based on the above analysis, F rates as a MODERATE BUY.
- Market Correction Impact
MarketConsensus would, however, like to caution investors that we believe a 5 – 10% Stock Market Correction is Coming. Market trend indicators are pointing to an overbought situation and a correction is a very real risk over the next 1-3 months. Investors should take this into consideration in their near term investing choices.
(By: Monty R. – MarketConsensus News Contributor)
Good luck in your investing,
MarketConsensus Stock Analysis Team
Follow Us:
Enter your e-mail address on the “Never miss a post!” section on the top right of this page and receive articles as soon as they are posted.
————————————————————————————————-