Bank of America Technical Stock Analysis
Bank of America currently trades at $14.74, which is $0.10 lower than the high end of its 52-week trading range ($6.90-$14.85). As seen on the 1-year stock chart below the stock has had a great run, travelling from the bottom left and upward to the right and making fresh higher-highs as it moves.
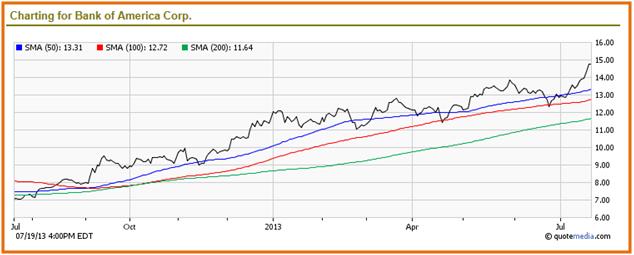
Over the period represented by the chart above, the stock has moved from $7.04, where it closed on July 20th 2012, to its latest closing price of $14.75 on July 19th 2013. That's an impressive gain of 109.52%!
See Also: Bank of America Stock Surges by 78% – Time to Sell The Stock?
Over this time horizon, the stock has broken through resistance at its 50-day, 100-day and 200-day Simple Moving Average (SMA) prices. During this period the stock broke through support at its 50-day SMA on at least 4 occasions, but has always rebounded back to gain new highs. Since mid-Apr 2013, the stock has twice tested support at its 100-day SMA but managed to bounce back up on both occasions, the most recent being on June 24th.
BAC has closed higher on 13 of its last 20 trading sessions, gaining 13.79% in value over that time. Since release of its Q2 earnings report on Jul 17, the stock has gained 5.87% in value from its pre-earnings release price. The average daily trading volume over the 20-day period has been roughly 123.5M shares. However, in the immediate aftermath of the Q2 earnings, BAC experienced a doubling of its average trading volume on June 17th and 18th.
Unless there are some drastically depressing fundamental factors in the near future, all technical signs point to the stock making new highs over the next few weeks of trading.
If you found this article helpful, do share it with others. Click on the Facebook, Twitter, LinkedIn or Email icon to the right of the “Share This Article” option below to share this piece with others.
Also:
Like us on Facebook
Follow us on Twitter
Circle us on Google +