Has Delta Stock Risen Too High, Too Fast? Is the Stock (DAL) a Buy or Sell at Current Prices?
Last week, Delta Air Lines stock (DAL) reached a new 52-week high of $15. Over the past one year, DAL has risen 51.69% (beating the S&P 500 index by 40%). As the stock continues to rise, a lot of investors are questioning whether it has risen too high, too fast. Is DAL still a good buy or has it become a sell or short opportunity?
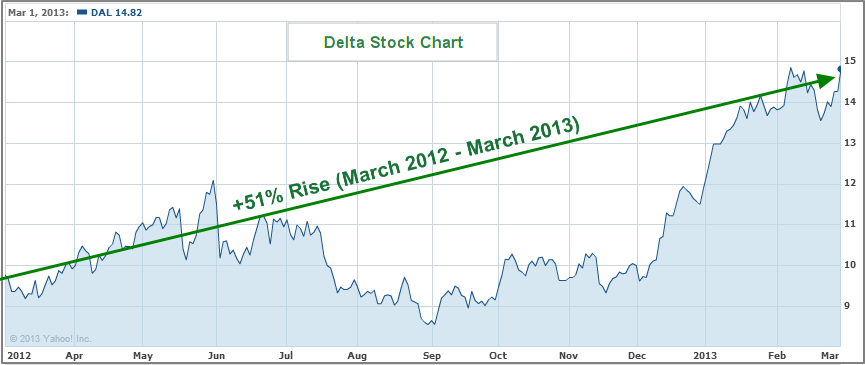
1 Year Chart: DAL
On March 1, 2013, TheStreet.com rated Delta stock (DAL) a Hold, stating: “the company's strengths can be seen in multiple areas, such as its solid stock price performance and revenue growth. However, as a counter to these strengths, we also find weaknesses including poor profit margins and weak operating cash flow”.
Taking the surge in the firm’s stock price and financial variables into consideration, this stock research report will attempt to answer whether Delta stock is a good Buy, Sell, Hold or Short.
Delta Air Line (DAL) Company Analysis and Research Report
- Fundamental Analysis
- Valuation Overview
- Stock Analysts Recommendations
- Bottom Line Conclusion
- Fundamental Analysis
Originally called Huff Daland Dusters, Delta Air Lines started as a small aerial crop dusting operation in 1924. It has grown to become one of the top 10 global airlines. Over 150 million travelers fly with Delta on an annual basis and the firm is also involved in cargo operations via its global freight gateways.
Delta recently filed its Form 10-K (Annual Report for Full Year 2012). Looking at the below screenshot of Delta’s consolidated income statement, two trends immediately jump out at you.
A. Trend 1: Increasing Revenue
The first trend is on the "Total operating revenue" row (highlighted with a red dotted border). We see that the firm’s operating revenue has been increasing year over year in the last 3 years. From 2010 to 2011, revenue increased by 10.58%: (35,115-31,755)/31,755. From 2011 to 2012, revenue also increased (by 4.43%), but this was much less than the 10.58% increase from the previous period. Nevertheless, the overall increase may support the view point of those who argue that Delta stock (DAL) is a buy or a hold in 2013.
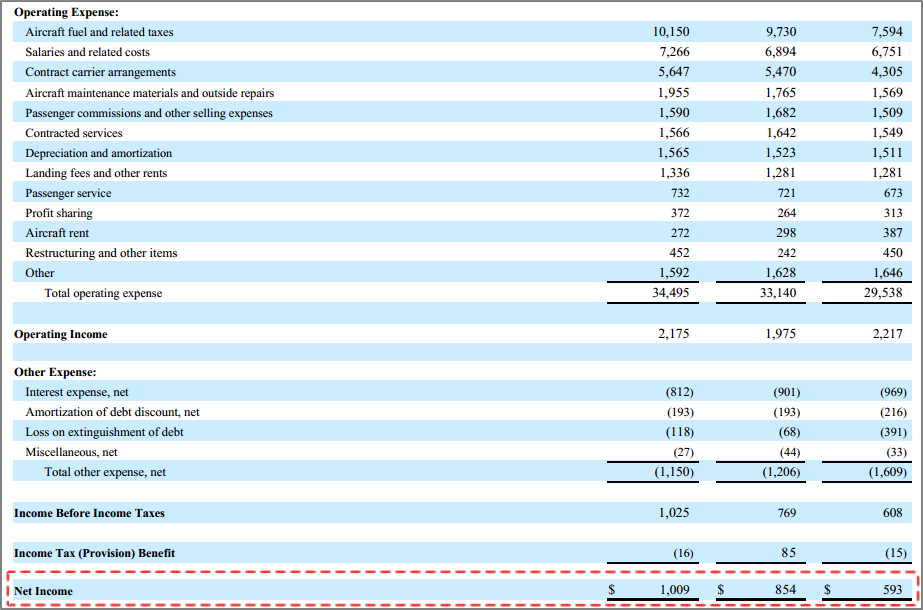
B. Trend 2: Increasing Net Income
The second trend is on the "Net income row" (also highlighted with a red dotted border). We see here that the firm’s net income (revenue minus all costs & taxes) has also been on a rise. In 2010, net income before taxes was $593 million. That number soared to $854 million, a 44% increase. In 2012, DAL reported $1 billion in net income, an 18% rise.
The above improvements in the firm’s financial figures have been major drivers in the stock’s 52% one year surge.
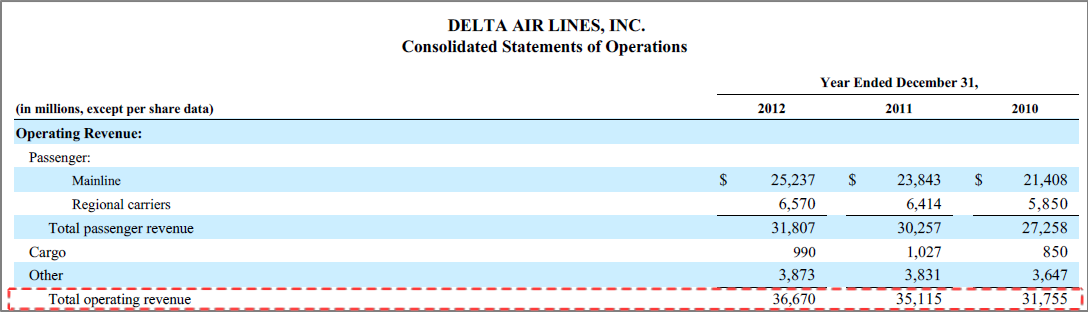
Delta Air Lines Consolidated Statements of Operations
- Valuation Overview
When determining the value of a stock, investors normally consider some distinct variables in their valuation analysis. These include a firm's financial margins, management effectiveness, growth rates, return on investments and other valuation matrix (EPS, P/E, Debt Ratio, Etc.)
DAL has a debt to total capital ratio of 120.15%, which is much higher than the Airlines industry average of 49.77%. Delta could find it difficult to service its debt given its Interest Coverage ratio of only 1.05. An Interest Coverage ratio determines how easily a firm can continue to pay interest on its debt. A ratio of 1.05 means DAL has slightly enough capital to continue paying short term interest on its debt without running into financial difficulties.
Delta has a Quick Ratio that is less than 1. Quick Ratio is an "acid test" or "quick test" used by investors to determine a firm's ability to pay its short-term obligations with available cash or liquid assets – in the absence of any income. This is important as a company needs to be able to pay its immediate short term interest or debt regardless of market or operational condition. DAL’s Quick Ratio of 0.55x means that the firm only has 55 cents of available cash to pay each dollar of short term debt – there are not enough liquid assets to satisfy current liabilities in the event that operating earnings are unable to. However, Delta’s Quick Ratio of 0.55x is in line with the industry average of 0.5x.
As shown on the below Financial Highlights for Delta, the firm has a Profit Margin (PM) of 2.75% and Operating Margin (OM) of 7.09%. The 2.75% PM is less than the industry average of 3.45%, while the 7.09% OM is also lower than the industry average. From a profitability perspective, it looks like Delta is underperforming the industry.
Delta Air lines shows a positive Return on Assets (ROA) of 3.69%. ROE and ROA are variables used by investors to determine management effectiveness. For each $1 of asset, DAL’s management is generating $0.036
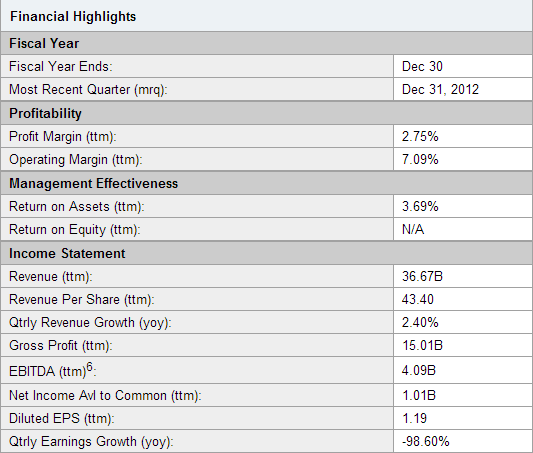
Although DAL has a negative Quarterly Earnings Growth, its Quarterly Revenue Earnings continues to grow at a 2.40% rate as shown on the Fundamental Analysis section above.
Continue: Delta Stock (DAL) – Risk Factors and Analysts Recommendations (Buy/Sell)
[related1][/related1]