Is IBM Stock a Good Buy, Sell or Hold? Does the Stock Make a Good Investment?
On Tuesday, April 30th 2013, IBM’s Board of Directors announced a cash dividend of $0.95 per share, a 12% increase from their previous quarterly dividend of $0.85/share. The increase did not come as a big surprise to investors as IBM has been raising dividends for 18 consecutive years now.
The one year stock performance chart below shows IBM's stock price in comparison with two of its competitors, Hewlett-Packard Co. (HPQ) and Microsoft Corporation (MSFT). IBM has clearly been the better performer for most of the year, except for the drop in April following its Q1 2013 results.
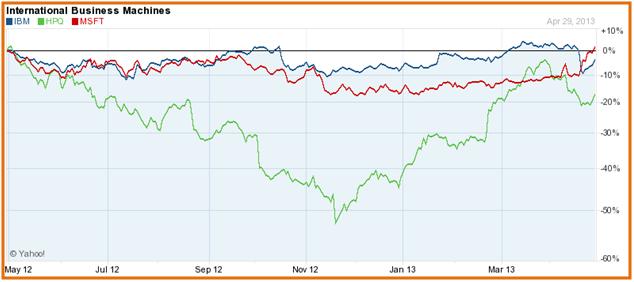
The steep decline that you see in the charts in late April 2013 represents a nearly 8% decline in the stock price, effectively wiping away all of the gains that the company had made over a 12-month period.
Under these circumstances, shareholders may be wondering whether IBM can quickly turn its fortunes around, and whether IBM stock is a good buy and hold or a sell/short.
Let’s assess the facts and try to address these questions.
International Business machines Corp. (IBM) Stock Analysis Breakdown
- IBM’s Fundamental Analysis
- IBM Stock Valuation Overview
- IBM – Technical Stock Analysis
- Favorable Catalysts for IBM Stock
- Bottom Line Conclusion
- IBM's Fundamental Analysis
IBM recently announced its Q1 2013 earnings, in which it reported a Net Income of $3.03B, down 1% from the $3.06B reported in the same quarter last year. Consolidated revenues for the company declined nearly 5% year-over-year, coming in at $23.4B. The company also reported a decline of its Free Cash flow, down to $1.7B from the $1.9B reported last year. All in all, this was a rather disappointing quarter for IBM stock investors.
(See Also: IBM Stock Crushes Rivals HP and Dell)
Of particular concern was the firm’s weak Hardware-related revenue, which came in 13% lower than last year. One bright spot in the announcement was the positive growth, of nearly 7%, in Mainframe-related revenues. However, a single-digit growth in a refreshed mainframe lineup (System z series) was less than what analysts were expecting. IBM’s Management was gracious enough to own up to poor execution of sales strategy for the shortcoming, and plans to execute more effectively in the next quarter.
Other areas of the company's hardware business, including its Storage Arrays, x86-based Servers and its Power Server range, all saw revenue declines of 11%, 9% and 35% respectively. There are now renewed rumors that the company may at last be ready to spin off its x86-server portfolio, allowing it to concentrate on the services, software and specialized/high-end hardware segment.
Although the company reported a 4% year over year decline in its Service revenue, it was able to grow its Backlog Catalogue by around 1%.
(See Also: Delta Stock Soars 51% in 1 Year. Too High, or is DAL still a Good Buy?)
On the Software front, IBM's performance was nothing to write home about. The revenue for this particular segment was $5.6B, which was essentially flat compared to last year's figures – this was largely as a result of weak performance in its Data Analytics and Database segments. Both these two areas are seen as strategic segments for the company, with any decline in market share representing a threat to IBM's dominant position. Analysts are hoping that deals which were in progress during the last quarter will finally materialize in the June quarter, fortifying the current quarter's results.
- Valuation Overview
IBM currently has a Market Cap of $224.82B, with an Enterprise value of $242.46B. It trades at a Trailing 12-month (TTM) P/E ratio of 13.97x and a Forward (F) P/E valuation of 11.04x. Comparatively, its larger rival MSFT has a Market Cap of $276.42B, but a much lower Enterprise value ($206.46B), and trades at 17.08x and 10.78x TTM and F P/E multiples respectively. On a P/E basis therefore, both Forward and Trailing, neither of the 2 competitors appear to be overly valued when compared to the Industry average of 23.4x.
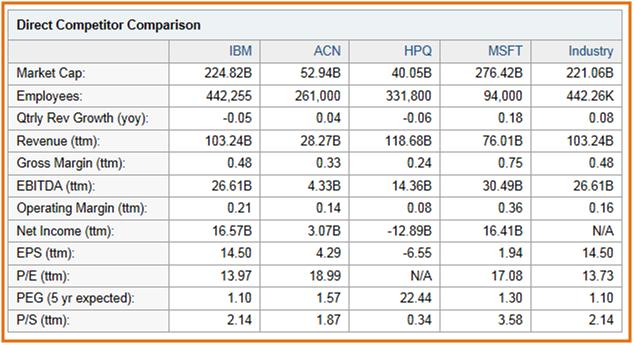
With a TTM Price/Sales valuation of 2.14x, IBM appears to have a slightly cheaper valuation than MSFT (3.58x).
- Technical Perspective
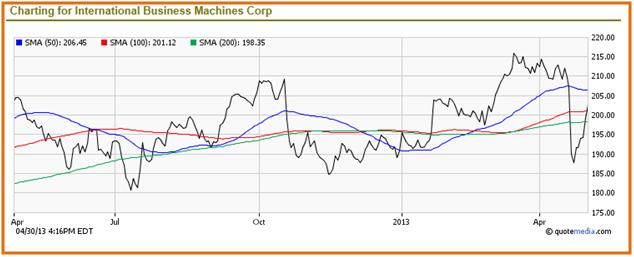
IBM's stock currently trades around $202.54, slightly below the higher-end of its 52-week range of between $181.85 and $215.90. After reporting its Q1 results in April, the stock declined nearly 8%, breaking through its 50-day, 100-day and 200-day Simple Moving Average (SMA) prices. Towards the end of April, the stock finally bottomed, at $187.83, and mounted a steady comeback to the current $202 level.
(See Also: Has Apple Lost its Innovative Touch? Apple (AAPL) Stock Analysis)
Yesterday’s announcement of a dividend hike as well as an expanded share buyback program by the Board has added impetus to the rise in the stock price. Based on the stock's movement so far, it would indicate that IBM is poised to regain most, if not all, of the ground lost due to the poor Q1 financial results.
Continue: Favorable and Negative Catalysts Impacting IBM Stock
Stay in Touch:
Facebook (Like Us on Facebook)
Google + (Connect with Us on Google+)
Contact Us (Questions/Comments)
[related2][/related2]
(By: Monty R. – MarketConsensus News Contributor)