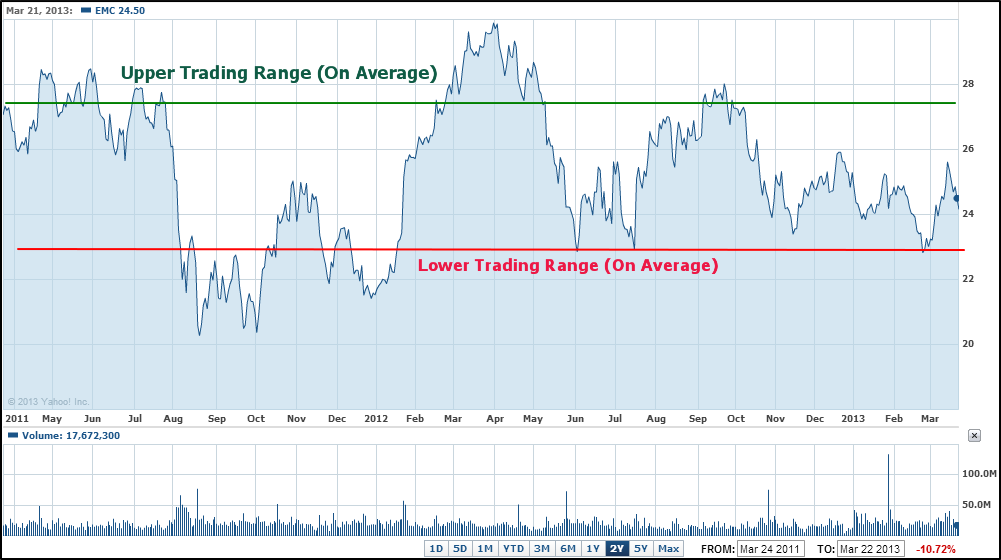
EMC Stock – 2Yr Trading Range
The slow economic and anemic job growth impacting the US over the last several years has led to a reduction in IT spending. This has greatly impacted not only EMC Corporation (EMC), but many of its competitors in the IT Infrastructure and Data Center management business.
Over the last two years, EMC has traded within a $23 and $27.75 bandwidth. The stock has not been successful in staying above the $27.75 price range. On the other hand, it has found support at the $23 average “low trading price range” by never staying below this price for a long period of time.
Given this dynamic trading contraint, investors are left wondering whether the stock is a good Buy, Hold or Sell. Let's review some key fundamental and technical data for EMC Corporation that might help answer that question.
EMC Corporation (NYSE: EMC) Stock Analysis Report
- EMC Fundamental Analysis
- EMC Valuation Overview
- EMC Technical Perspective
- Favorable/Negative Catalysts for the Stock
- Bottom Line Conclusion on EMC
- EMC Fundamental Analysis
EMC has an exceptionally strong balance sheet with nearly $7B in free cash flow. It has cash and cash equivalents valued at over $11B. This not only places the company in a strong fundamental position, but also ensures that it can weather any upcoming economic storms better than its competitors. Additionally, EMC can easily use this strong cash position to pursue a growth-by-acquisition strategy.
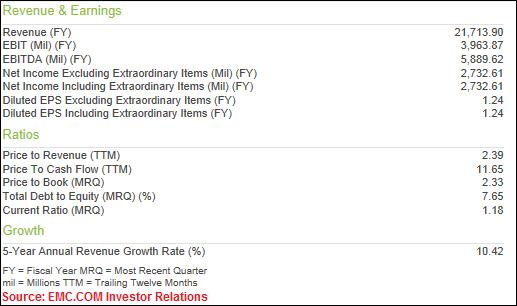
For 2012, EMC reported Revenue of $21.71B. While this represented an 8.53% improvement over 2011 revenue, which came in at $20B, the rate of increase has been on the decline for the third consecutive year. 2010 ($17B) saw a 21.31% increase in revenue from 2009 ($14B), while 2011 ($20B) saw only a 17.59% increase in revenue from 2010.
The company's Operating Income (EBIT) for FY-2012 came in at $3.96B, 15.15% higher than its $3.44B 2011 EBIT figure. One very significant achievement for EMC is probably the Total Operating Expenses reported for 2012. This figure, which came in at $17.75B, was only 7.15% higher than that reported a year earlier ($16.56B). The significance of this lies in the fact that the rate of increase was almost half of the 2011 increase (15.58%) over 2010 Operating Expenses ($14.33B). Clearly management has done a stellar job in reigning in operating expenses, which has contributed to the bottom line.
Given the gloomy economic conditions faced by corporations over the past 2 to 3 years, which have put a squeeze on IT spending, EMC has done well to report an 11.02% increase in Net Income ($2.73B) compared to last year ($2.46B).
Of additional interest to shareholders is the fact that EMC has, for the third straight year, reported a strong increase in Operating Cash Flow of $6.26B. That's a healthy 10.47% increase over the $5.67M reported a year earlier, and a 37.67% increase over Operating Cash Flow from 2010. Once again, this proves that the company has a strong cash-generating business model.
- Valuation Overview
At the time of this analysis, and based on Morningstar data, EMC seems to be very reasonably valued when compared to most valuation metrics for the company, the Industry and the S&P 500. The stock is also trading well within its 5-year average of most valuation metric.
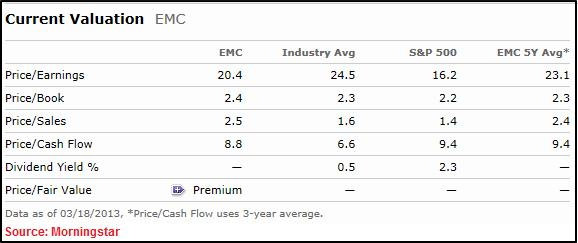
At 20.4x Price/Earnings, EMC may look a bit over-valued to some investors. However, if you put this valuation in perspective of other indicators, such as the P/E for the Industry (24.5x) and that of the S&P 500 (16.2x), the stock looks fairly valued. And when you consider that larger-cap competitors like IBM are valued at 14.9x, one gets a further sense of EMC's fair valuation.
Other valuation measures, such as its 8.8x Price/Cash Flow compared to IBM's 12.6x, and its 2.5x Price/Sales versus IBM's 2.4x, further cement our view that EMC is reasonably priced at these levels. In fact, on a Price/Book value basis, EMC (at 2.4x) is trading at a significant discount to IBM (12.6x). However, one must keep in mind that EMC has a significantly smaller market cap ($52.24B) than IMB ($240B).
Continue: EMC Stock Technical Analysis and Favorable Catalysts – Will EMC Stock Rise Again?
(By: Monty R. – MarketConsensus News Contributor)
Good luck in your investing. Let us know if you have any questions, comments or feedback,
MarketConsensus Stock Analysis Team
Stay in Touch:
Google + (Connect with Us on Google+)
Twitter (Follow Us on Twitter)
Facebook (Like Us on Facebook)
Contact Us (Questions/Comments)
————————————————————————————————-
[related2][/related2]