
Fannie Mae (Federal National Mortgage Association) Stock Surges Over 400% – Is FNMA Buy?
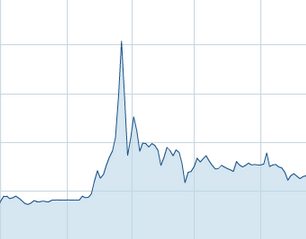
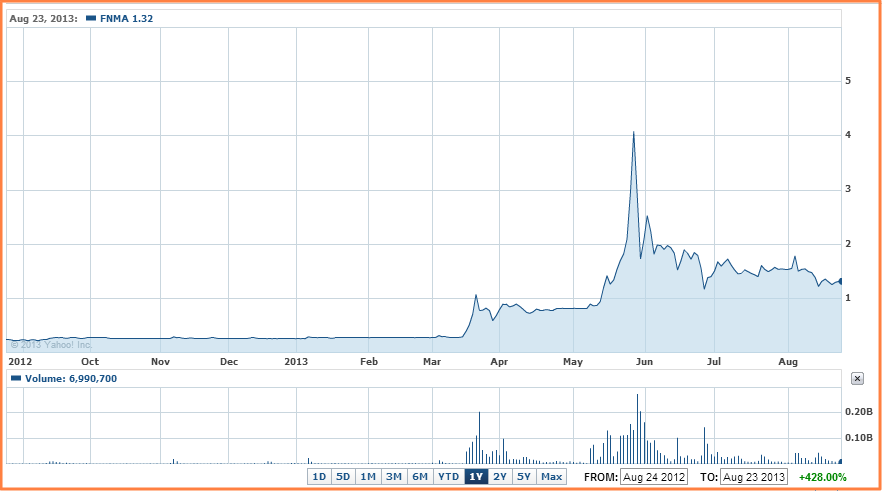
Is Fannie Mae (stock: FNMA) a good buy or a worthless investment at the current price? Since August of last year, FNMA stock has surged 400%.
Given this latest sign of recovery in Fannie Mae share prices, investors may be wondering if Fannie Mae stock is a good buy, sell or hold.
Does the stock present a once in a lifetime investment opportunity? Or will it prove to be a worthless investment for investors buying at the current market price?
Let's review the various fundamental, comparative valuation and technical variables to determine how best to rate this seemingly highly “speculative” stock.
Fannie Mae Stock Chart – 1 Yr
Fannie Mae (FNMA) Stock Analysis – Is FNMA a Good Investment?
- FNMA Fundamental Analysis
- Fannie Mae Comparative Valuation
- Technical Stock Analysis
- Favorable / Negative Catalysts Impacting FNMA Stock
- Bottom Line Conclusion – Buy or Sell Fannie Mae Stock
FNMA Fundamental Analysis
The infamous "housing bubble" burst in 2008 led to Fannie Mae and big brother Freddie Mac (FMCC) being taken into conservatorship by the Federal Housing Finance Agency (FHFA). There is no specific date for the termination of this conservatorship, nor are there any guidelines as to how the relationship will be terminated. The Treasury has also placed stringent restrictions on the business activities that the company can pursue, and has significantly enhanced the amount of scrutiny and transparency required of the company.
When Fannie Mae was delisted from the New York Stock Exchange on June 6, 2010, it began trading on the Over-The-Counter market under the symbol "FNMA".
When FNMA released its June “Monthly Summary”, it reported a 1.9% decrease in its Book of Business. This contrasts poorly from the previous month, when the Book of Business grew at a 0.3% annualized rate. On a slightly positive note, while the company's Gross Mortgage Portfolio declined at an 18.4% compound annualized rate in June, the rate of decrease was lower than the 23.7% seen in May.
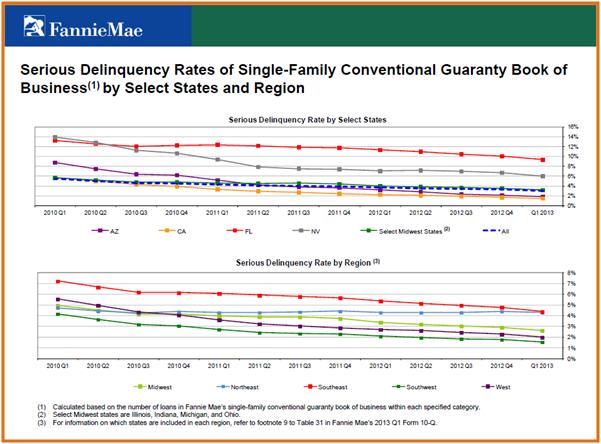
In more good news for the company, its Conventional Single-Family Serious Delinquency
Rate came in at 2.77%, a fall of 6 basis points from May's 2.83% rate. While its Multifamily Serious Delinquency Rate fell 2 basis points to 0.28%, as is evidenced from the long-term trend graph above, delinquency rates for the company are in an overall declining pattern. This is a very positive factor for the firm’s profitability prospects.
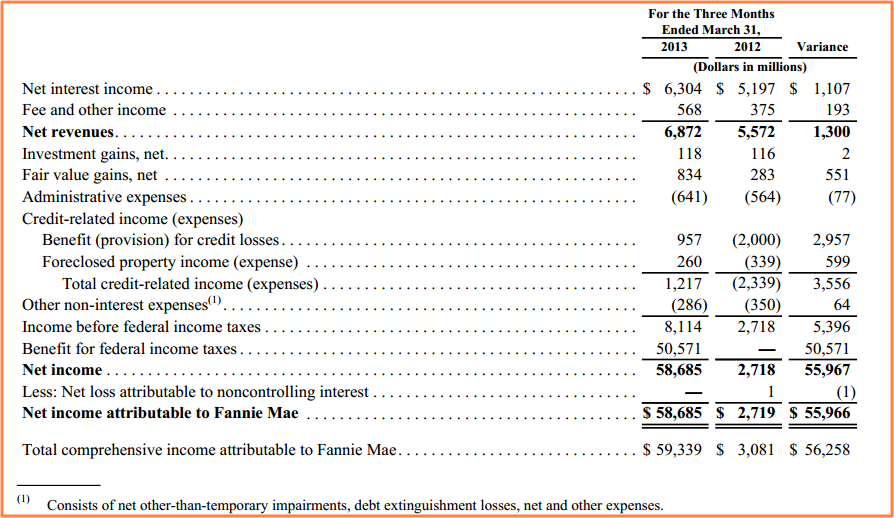
These improvements come on the heels of FNMA’s Q1 2013 results, released on May 8, 2013. For the quarter, the company reported $8.1B in pre-tax income, which was the largest of its kind in the company's history. The company's after-tax net income came in at $58.7B (due to a $50.57B gain from federal income tax benefits), which was a staggering 672% higher than the $7.6B from Q4 2012.
Fannie Mae Latest Consolidated Results of Operations
In early July 2013 the company also gave the world a brief glimpse into what to expect for Q2 2013. For the second quarter, the company's new multi-family business volume had totaled nearly $7.6B. The company also confirmed that Fannie Mae Capital Markets had sold approximately $5.5 billion of multifamily mortgage securities from its portfolio in Q2 2013.
Fannie Mae Comparative Valuation
Of the 4 peers represented in the comparative valuation table below, FNMA ranks third when valued on a Market Cap ($9.12B) basis. However, with an Enterprise Value of $3.09T, the company is a giant compared to its other three competitors.
Fannie Mae (FNMA), Equity Residential (EQR), Boston Properties Inc. (BXP), Nationstar Mortgage Holdings Inc. (NSM)
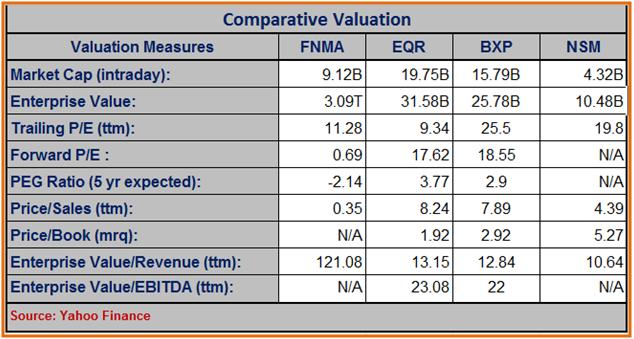
On a Trailing P/E valuation, FNMA trades at 11.28x its Trailing 12-Month (TTM) earnings. This makes it a slightly cheaper stock than EQR (with TTM P/E of 9.34x), but significantly cheaper than BXP and NSM who are trading at 25.5x and 19.8x their TTM earnings respectively.
Valued at 0.69x, FNMA is also cheaper on a Forward P/E basis when compared to EQR (17.62x) and BXP (18.55x). The company trades comparatively cheaper than its peers on a TTM Price/Sales (0.35x) valuation too, when compared to the 8.24x, 7.89x and 4.39x valuation for EQR, BXP and NSM respectively.
With a TTM Profit Margin of 287.09%, FNMA is handily the most profitable of companies when compared to EQR (80.59%), BXP (31.14%) or NSM (22.11%). The company's TTM Operating Margin (90.41%) far outshines that of its rivals too (25.51%, 34.69% and 25.61% respectively). FNMA also boasts of a significantly higher TTM Return on Equity (233.69%) than its three other competitors (1.36%, 10.82% and 30.72% respectively). Only NSM has a better Year/Year Quarterly Revenue Growth profile (145.60%) than FNMA (126.30%), towering high above the other two rivals (EQR, 19.80% and BXP 4.30%).
Technical Perspective
Interested Stock Technicians / Chartist: click here to review Fannie Mae’s Technical Stock Analysis
Favorable / Negative Catalysts Impacting Fannie Mae Stock
As evidenced by the company's Q1 2013 results, FNMA is still a major player in the mortgage lending business. It remained the largest single issuer of single-family mortgage-related securities in the secondary market. While its market share declined from 51% in Q1 2012 to 48% in Q1 2013, this market share is still significant for the company to mount its planned turnaround.
Going into controllership may have been just what the struggling FNMA needed to start getting back into profitability. The company has had a major management shakeup, with 80% of its current senior staff, and all members of the management committee, taking office since September 2009, when the company was taken over by the FHFA. Additionally, over 50% of the company's current workforce was hired following the FHFA takeover. This means there is new blood and newer ideas flowing throughout every level of the company, which bodes well for the company's future.
FHFA controllership has enforced even tougher rules for the company's operations. This means greater degree of diligence, and more transparency in operations. This is indeed a welcome step for shareholders and homeowners alike, and could boost confidence in the company. However, overly restrictive legislative control, and undue bureaucracy could also be a negative catalyst for the company, especially when quick and decisive action may be required to benefit from fleeting opportunities, if they ever present themselves.
The ongoing housing recovery in the U.S. is indeed a favorable catalyst for the company. According to the company's Economic & Strategic Research Group, mortgage rates will gradually continue to rise at an average pace of 4.7 percent in Q4 2013. Rising mortgage rates will obviously be a favorable catalyst for the company's future growth and profitability. The fly in the ointment however could come in the form of uncertainty over the impact that quantative easing may bring to the housing market.
From an investor's standpoint, the uncertainty over the future of the FHFA-FNMA relationship is proving to be a negative overhang on the stock's performance. As things stand, no one knows when (or if) the company will move out of conservatorship, or what a post-conservatorship FNMA might look like. Investors aren't even sure if the company will be allowed to exist once it exits from conservatorship. Additional clarity around these questions could provide a positive force to investor sentiment about the company.
Bottom Line Conclusion
Based on our above analysis, we rate FNMA stock as a HOLD for now. However, several more quarters of sustained and robust growth in the U.S. Housing market, as well as continued strengthening of FNMA's credit profile may cause FNMA stock to rate as a BUY. Greater clarity into a post-conservatorship FNMA structure might also require a re-evaluation of the investment thesis.
If you found this article helpful, do share it with others. Click on the Facebook, Twitter, LinkedIn or Email icon to the right of the “Share This Article” option below to share this piece with others.