FNMA currently trades around $1.56, well below the upper limit of it 52-week trading range of between $0.09 and $5.44.
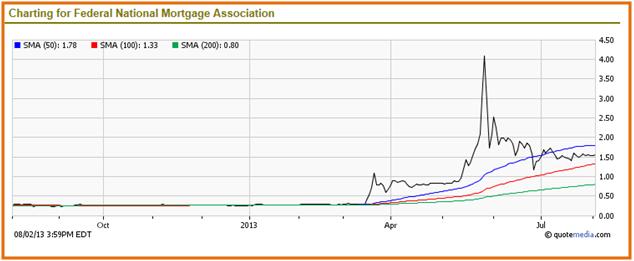
Trading largely flat for most of the last year (as seen on the stock chart above), the stock started an upward move in early March 2013, based on an improving U.S. housing picture and investor sentiment on what that could mean for the company. Fannie Mae’s stock price recorded a spectatular spike as a result of its better than expected Q4 2012 and much improved full-year 2012 results (released April 2, 2013).
See Also: 5 Best Online Trading Sites (2013) for Investors – Best Online Brokers
Investor euphoria with the stock was short lived, however, as a late May 2013 report painted the housing recovery in not so rosy words as previously projected. The stock continues to gyrate with each burst of good and bad news, but has been trading within a narrow price channel of $1.35 and $1.78 over the last 20 trading sessions.
See Also: 12 Best Banks to Bank With | No Fees
The stock closed at $0.29 at the end of the trading day on Aug 7, 2012. On a year-over-year basis therefore, the latest closing price ($1.56) reflects a gain of over 438%. The stock has closed lower in 11 of its last 20 trading sessions, losing nearly 5% of its value in that time frame. However, on a more shorter timeframe, the stock has gained almost 11% over the last 10 days of trading.
Other News: Is Nokia Stock a Buy or Sell? NOK Stock Valuation Analysis
If you found this article helpful, do share it with others. Click on the Facebook, Twitter, LinkedIn or Email icon to the right of the “Share This Article” option below to share this piece with others.
Also:
Like us on Facebook
Follow us on Twitter
Circle us on Google +