
We have been investigating a lot of large cap tech stocks here at MarketConsensus News. The Sprint Nextel (S) earnings report recently came out (February 7, 2013) and we decided to analyze it here for you.
Stock Price Action:
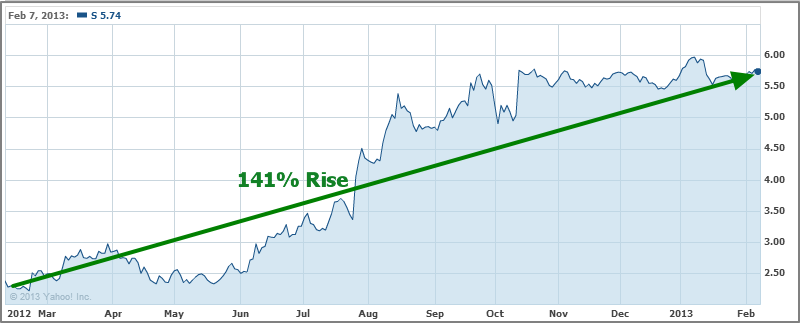
Sprint Nextel’s stock price has risen an astounding 141% since February of 2012. This rise has caused investors to question whether the stock has run too far, too soon. Has the firm’s financial condition improved sufficiently to warrant such a move in the stock price? Most importantly, has Sprint’s stock (S) now become a buy, sell, hold or short?
Let’s take a look at the various facts to better assess the answers to these questions.
Income Statement:
We analyzed Sprint’s income statements over the last five years to bring you the tables below, where you can see that sales have increased steadily every quarter in 2012. This is great news indeed!
However, there are also some glaring issues. For the past five years (see second table: 2008 – 2012 Sprint Income Figures), the firm has reported negative net income and negative EPS. It has also experienced a high level of volatility in its reported net income figures during this five year period.
2012 Quarterly Income
|
Income Statement |
||||||
|
Quarter |
Sales |
Growth |
Net Income |
Growth |
EPS |
Growth |
|
2012 Q4 |
$9005 |
2.76% |
-$1321 |
-72.23% |
-$0.44 |
-69.23% |
|
2012 Q3 |
$8763 |
-0.90% |
-$767 |
44.18% |
-$0.26 |
43.48% |
|
2012 Q2 |
$8843 |
1.25% |
-$1374 |
58.86% |
-$0.46 |
-58.62% |
|
2012 Q1 |
$8734 |
0.14% |
-$863 |
33.77% |
-$0.29 |
32.56% |
2008 – 2012 Sprint Income Figures
|
Year |
Sales |
Growth |
Net Income |
Growth |
EPS |
Growth |
|
2012 |
$35340 |
4.93% |
-$4325 |
-49.65% |
-$1.44 |
-50.00% |
|
2011 |
$33680 |
3.44% |
-$2890 |
16.60% |
-$0.96 |
17.24% |
|
2010 |
$32560 |
0.93% |
-$3465 |
-42.24% |
-$1.16 |
38.10% |
|
2009 |
$32260 |
-9.48% |
-$2436 |
12.88% |
-$0.84 |
14.29% |
|
2008 |
$35640 |
-11.12% |
-$2796 |
90.62% |
-$0.98 |
-51.24% |
Note: All values in the tables are in Millions of USD (except for per share items)
Balance Sheet:
In addition to its volatile net income, Sprint also has a weak balance sheet as shown below. The firm’s recent earnings release revealed $8.20B in cash, an amount that has been growing nicely over the last five years. This, however, is about the only good thing in the balance sheet for the telecommunications giant. Equity has been on a decline over the period shown below, dropping on average 15.3%.
|
Year |
Current Assets |
Total Assets |
Current Liabilities |
Total Liabilities |
Cash |
Equity |
Growth |
Shares |
Growth |
|
2012 Q4 |
$13760 |
$51570 |
$8874 |
$44480 |
$8200 |
$7087 |
-16.61% |
3000 |
-0.10% |
|
2012 Q3 |
$11610 |
$48970 |
$7947 |
$40470 |
$6329 |
$8499 |
-7.89% |
3003 |
0.13% |
|
2012 Q2 |
$11600 |
$49020 |
$7363 |
$39800 |
$6762 |
$9227 |
-12.87% |
2999 |
0.07% |
|
2012 Q1 |
$12220 |
$50620 |
$6439 |
$40030 |
$7572 |
$10590 |
-7.35% |
2997 |
0.03% |
|
2011 |
$10340 |
$49380 |
$6499 |
$37960 |
$5597 |
$11430 |
-21.44% |
2996 |
0.27% |
|
2010 |
$9880 |
$51650 |
$7891 |
$37110 |
$5473 |
$14550 |
-19.61% |
2988 |
0.50% |
|
2009 |
$8593 |
$55420 |
$6785 |
$37330 |
$3924 |
$18100 |
-9.14% |
2973 |
4.06% |
Note: All values in the table are in Millions
When compared with the titans in the communications industry (AT&T, Verizon, etc.), Sprint just doesn't match up. There are even more troubles for Sprint in the form of “shares issued” continuing to increase since 2009 and a considerable sum of intangible assets in the books as well; not a good sign for a value investor.
Continue: Price Ratio Stock Analysis for Sprint (S) – Buy Sprint Stock?