Should Investors Take Some Profits off the Table?
The longest winning streak in the S&P 500 since 2004 has taken U.S. markets to within a hair’s breadth of their all-time highs, reached in 2007. Continual quantitative easing by the U.S. Federal Reserve has been a major factor contributing to the rise in asset prices. In addition, temporary resolutions to the fiscal cliff, positive corporate earnings (bottom line improvements) and improving economic indicators have all combined to support this rise.
We would, however, like to take this opportunity to caution investors on what we see as an imminent stock market correction.
1-Yr Peak Line has been Crossed
Looking at the below 1 year chart of the Dow (DJIA), S&P 500 and Nasdaq, we notice that in January 2013, all three major stock indexes have crossed their 1-Year “Horizontal Peak Line” level. Twice in 2012 (March and September), when the major indexes reached or passed this level, it resulted in a peak market condition – a situation that was subsequently followed by an average 10% stock market correction.
Jan 2012 to Jan 2013
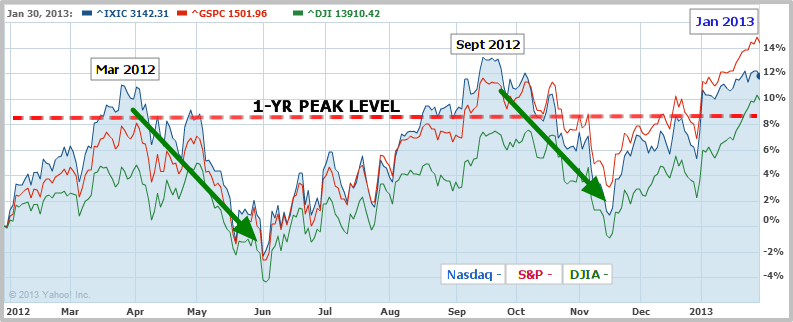
Yahoo! Finance
Overbought Analysis
As recently reported by CNBC: Insider selling has increased and corporate executives have been pulling out of stocks just as small investors are getting in. "Insiders know more than the vast majority of market participants," said Enis Taner, global macro editor for RiskReversal.com. "And they're usually right over a long period of time."
Bespoke Investment Group is also reporting that “79.6% of the stocks in the S&P 500 have reached overbought conditions”. Bespoke analysts also stated that “90% of the stocks in the S&P 500 are currently trading above their 50-day moving averages. This is the highest reading we've seen over the last year”.
Update 3/11: 5% – 10% Stock Market Correction is Coming (Between March and June 2013)
The S&P 500 has posted strong consecutive gains and now sits near the very top of its 20 period upper Bollinger Band for daily, weekly and monthly timeframes. The Shiller P/E, a long term measure of market valuation, is also high at over 22 (37.6% higher than the historical mean of 16.5). Another major indicator, the Moving Average Convergence-Divergence (MACD), is also in overbought territory.
The DJIA is now less than 2% from its all-time high of 14,164.53 – reached on October 7, 2007.
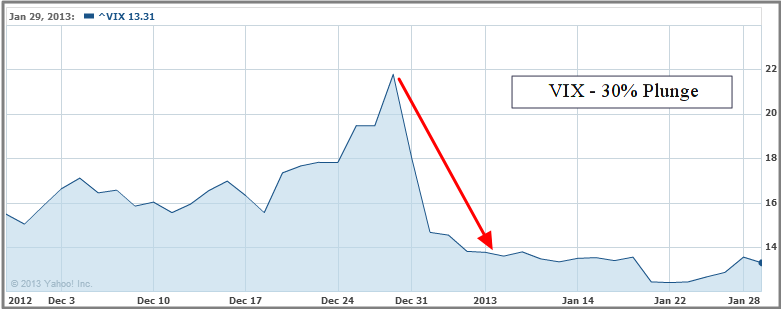
Volatility is Signifying Market Complacency
Volatility, as measured by the VIX index, has fallen 30% in 2013 to levels not seen since 2007. The VIX now sits at around 12.5. The VIX is a good indication of fear in the market, and levels below 14 have historically signified investor complacency and a possible stock market bubble. A recent CNBC article talks about how bears, after a long period of shorting the market, are now throwing in the towel. Historically, this has been a well-tested indication that the market may be reaching a short term peak.
In the above CNBC report, Walter Zimmerman, senior technical analyst at United-ICAP, said: “We are reaching capitulation levels. What troubles me is there's never been a happy ending from that combination of extreme complacency”. Quincy Krosby, chief market strategist at Prudential Annuity, was also quoted as saying: "If the market keeps moving higher, not worrying about anything, it's going to be difficult for the bulls. The market's not climbing a wall of worry – it's not worrying about anything. Typically when that happens something will come along to pull it back".
Fundamentals
So far, most of the gains in stocks have been driven by better than expected corporate earnings with companies like Exxon and Netflix reporting strong growth. With the spotlight on corporate earnings and away from the usual issues surrounding U.S. debt and Europe, there has been space for stocks to advance.
The super accommodative monetary policy from the Fed has undoubtedly helped to fuel the fire.
There are, however, still issues surrounding the global economy. Europe might well come back as a concern for investors – every year (for the past three years) this has seemed to be the case. A recurrence of the European crisis will put pressure on stock markets around the world.
Other News: Protecting Yourself against a Market Correction – Defensive Investing
Bottom Line
With earnings season not yet over, momentum may yet take the market on to new highs in the short term. But with most indicators pointing to over-valuation, this is not a good time for investors to enter the market. In fact, these levels offer a good chance to take some risk off the table and await the expected market downturn.
Accommodative monetary policy will underpin the market for some time to come but a correction between 8% and 12% is a very real risk over the coming one to three months. (Any more than this, could be unlikely given the fact that Fed policy puts a somewhat artificial floor under the market).
(By: Ogbe A. – MarketConsensus News Contributor)
Good luck in your investing. Let us know if you have any questions, comments or feedback,
MarketConsensus Stock Analysis Team
Stay in Touch:
Facebook (Like Us on Facebook)
Twitter (Follow Us on Twitter)
Google + (Connect with Us on Google+)
Contact Us (Questions/Comments)
——————————————————————————————
[related2][/related2]