KeyCorp (KEY), like its peers Bank of America Corp (BAC) and U.S. Bancorp (USB) has not been untouched by the U.S. financial crises. And like all of its peers, it too has been working feverishly to jettison its tainted assets and enact painful cost cutting, like the closure of 19 additional branches in 2012.
(See Also: Why BAC is a good Buy in 2013 – Bank of America Stock Analysis)
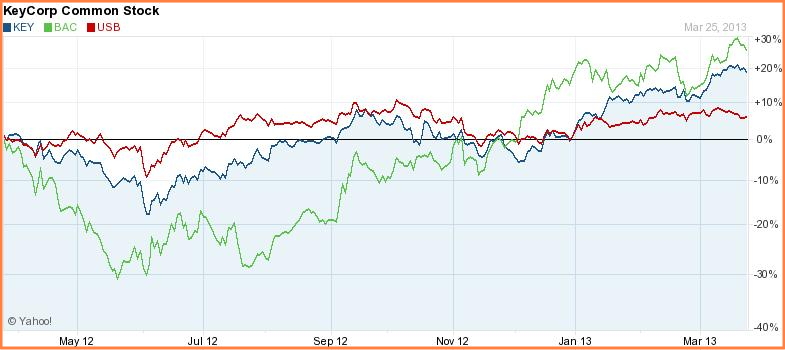
As is indicative in the stock price chart above, KEY's shareprice has seen a steady recovery, like its peers, over the past year. The question now on Shareholder's minds might be whether all the measures to shore up its balance sheet were sufficient to endear the bank to investors. Shareholders might be asking if the stock is a Buy, Hold or sell.
Let's review key fundamental and technical data for KEY that might help answer that question.
KeyCorp Stock Analysis Breakdown [Is KeyCorp (KEY) Stock a Buy, Sell or Hold?]
- KEY Fundamental Analysis
- KEY Valuation Overview
- Technical Perspective on KeyCorp Stock
- Favorable Catalysts for the Stock
- Bottom Line Conclusion
- Fundamental Analysis
For the fiscal year ended Dec 2012 KEY reported Interest Income of $2,705M, which was a 6.3% decline from the $2,889M reported in 2011. However, the Bank reported a healthy decline of over 29% in Interest Expense over the last fiscal year, down to $441M from $622M last year.
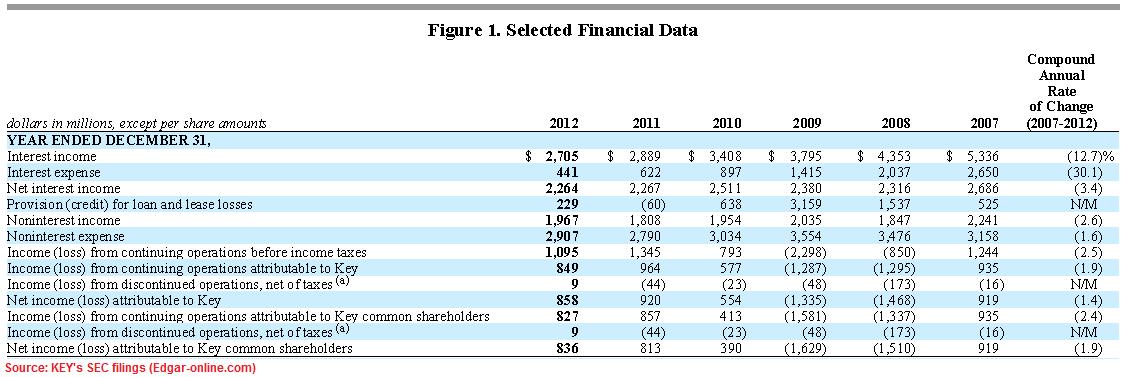
Shareholders would be pleased to also note that Net Income attributable to shareholders continued to improve for the third consecutive year to $836M, up from $813M and $390M in 2011 and 2010 respectively. The company had a Net Interest Margin of 3.21% for 2012, which was a slight improvement (by 5 basis points) from 2011. KEY also recorded a $1.8B increase in its average total loans, which amounted to a 3.6% improvement compared to last year.
(See Also: LNKD Rises 52% – Is LinkedIn Stock (LNKD) a Good Buy or Sell in 2013?)
On a per diluted share basis, KeyCorp's EPS came in at $0.89 for full year 2012, compared to the $0.87 and $0.44 reported in 2011 and 2010 respectively. The company's Return on Average Total Assets came in at 1.05%, which was lower than the 1.17% reported last year. However, when compared to the dismal 0.66% of 2010, and negative -1.35% and -1.29% of 2009 and 2008 respectively, the current ROA is certainly much healthier than those produced during the height of the financial crises.
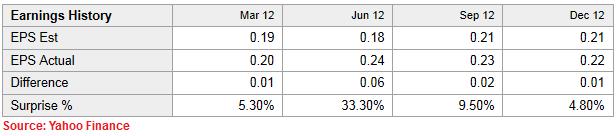
Q4-2012 results represent the 4th consecutive quarter that KEY has beat analysts' expectations for EPS, even though prior beats have been on a relatively higher scale. All in all however, investors should be relatively pleased with the company's performance, especially given the fact that the U.S. economy is still in the early stages of a recovery.
- Valuation Overview
At the time of this analysis, KEY appears to be trading at a comparatively fair valuation to its Industry peers, though it does seem slightly undervalued as can be seen below when compared to the Industry Average and also to the S&P 500.
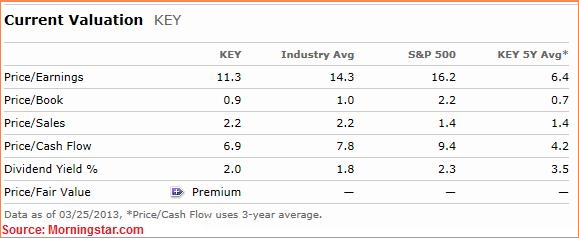
When valued on a P/E basis, KEY trades at 11.3x which is roughly 20% lower than the Industry average of 14.3. However, at those levels it trades at a significant discount of 30% compared to the S&P 500. Using this metric to value its competitors, we see that BAC trades at 49.5x its P/E while USB's P/E multiples are in line with KEY at 11.9x.
(See Also: Will Citi (C) Continue to Rise in 2013? Stock is up 41 Pct Since Sept)
On a P/B value, KEY is not that expensively valued at a 0.9x multiple against a 1.0x valuation for the industry. Competitors BAC and USB trade at P/B multiples of 0.6x and 1.8x respectively. On a P/CF basis however, while KEY trades at a valuation of 6.9x, the S&P 500 average is 9.4x, which means KEY trades at a significant discount to the index.
Continue: KeyCorp is up 18% YTD – Is KEY Still a Good Buy? Or at the End of its Run?
————————————————————————————————-
[related1][/related1]