Fundamental flaw of Fundamental Analysis
In our previous segment on Investment Analysis 101, we spoke about analyzing a stock's price based on the underlying fundamentals of the company. However, there are bodies of investment analysts that don't believe Fundamental Analysts are correct in their principles. One such group of people are those that advocate the principles of Technical Analysis
Technical Analysts believe that when a stock's price moves up, down or sideways, it has already taken into consideration all of the fundamentals of the company. They therefore criticize Fundamental Analysts for analyzing data (like Price to Earnings, Price to Book Value, Price to Sales) that is retrospective in nature – these things (Earnings, Sales) have already happened by the time the Fundamental Analyst reviews them. In the eye of the Technical Analyst therefore, Fundamental Analysis is flawed because current stock prices have already priced in all the fundamentals.
Let's therefore talk briefly about what Technical Analysts believe.
[related1][/related1]
What is Technical Analysis
Technical Analysis is an technique for analysing stock prices based on volume of shares traded and price momentum, either up, down or sideways. Because they believe that a stock's price has already taken into consideration company, industry and market fundamentals, Technical Analysts use a number of graphs, charts and other technical tools to analyse a stock without giving any consideration to the fundamentals. To them, other than volume and price, everything else is "noise" that distracts an analyst.
Technical Analysis revolves around a set of theories that define how stock prices are determined. Using these pillars of analysis can help a Technical Analyst identify and interpret trends, patterns and cycles of activity related to price and volume momentum about a stock. Three of the most important of these theories are:
- A Stock's fundamentals are already priced into its stock prices: This theory states that everything to do with the fundamentals of a stock, whether its political, macro-economic, social, psychological, investor sentiment, is already priced into the stock price. Looking through the Balance Sheet, the Income Statement, the Cash Flow Statement of a company, or listening to other news about the stock is therefore unwarranted and irrelevant to its price.
- There are trends that determine a stock's price: Technical Analysts believe that a trend in stock prices, whether up, down or sideways, will continue until it is interrupted or reversed. Stocks that achieve a trend of higher highs together with higher lows are said to represent a bullish trend. Similarly, any stock exhibiting a series of lower lows and lower highs is said to be displaying a bearish trend. For instance, after a stock has had 3 of its most prolific high-points, and an equal number of low-points, Technical Analysts believe that one can draw "channels" representing upper and lower limits to predict a trend or its reversal.
- History repeats itself: Technical Analysts believe in the famous warning from George Santayana, who is quoted as saying that "Those who do not remember the past are condemned to repeat it!" In other words, Technical Analysts believe that it is possible to predict how a stock is likely to move based on a study of its past movements over a short, medium and longer term, or through cyclical or seasonal periods.
[related2][/related2]
Tools of the trade
Just as Fundamental Analysts use tools such as various Ratio and Multiples to analyse the fundamentals of a stock, Technical Analysts have a bag of tools at their disposal to analyse the technical characteristics of a stock. Some of the most common tools are:
Simple Moving Average (SMA) Charts: This technique uses a series of simple moving averages for a set of periods, for instance 9-days (blue), 50-days (red) and 200-days (green), plotted on a graph of the stock's historical prices (black) to help Technical Analysts assess whether a stock's price is exhibiting signs of upward momentum or a downward trend.
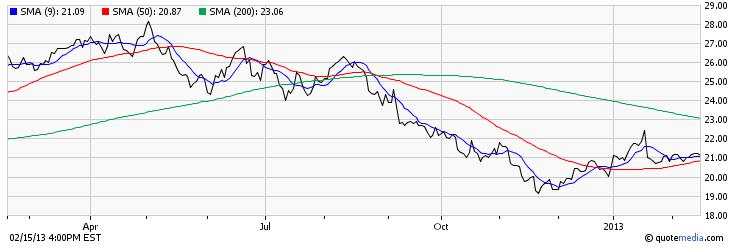
Technical Analysts use such charts, in conjunction with several interpretive techniques, including the Golden Cross (where a short-term SMA crosses a longer-term SMA, but in an upwards trend) and the Death Cross (where a short-term SMA crosses a longer-term SMA, but in a downward spiral) to predict long, short and intermediate-term movements in the stock's price.
Moving Average Convergence Divergence (MACD) lines : Are a series of 2 indicators, the MACD line (blue line in the chart below) and the Signal or average line (red), that are imposed on a histogram (or a price trend line) of the historical price data for a stock.
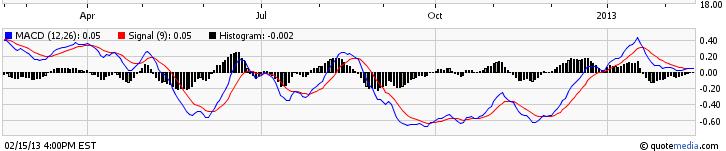
These lines show a potential investor the convergence or divergence of a stock's price from its historical prices.
- Fundamental Analysis – How to Value a Company
- Growth Investing for The Individual Investor (Growth Stocks)
- US Savings Bonds | Quick Guide for Investors | EE, I Bonds
- Bonds Investment 101 | What are Bonds? How Can I Invest?
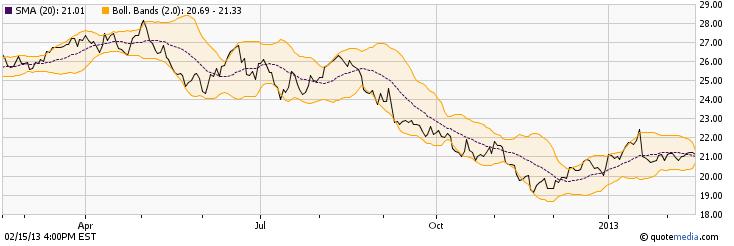
Bollinger Bands : Created by John Bollinger in the 1980's, and trade-marked in 2011, the Bollinger Band and related %b indicator are tools that can be used to highlight the "highness" and "lowness" of a stock's price, in relation to historical stock prices. Using this tool, and based on a default calculation of a 20-period window, +/- 2 standard deviations, traders develop a "relative" definition of the high and low prices for a stock, which are represented by the upper and lower band of the Bollinger Band respectively.
Candlesticks: Originally developed in Japan as a tool to track the price of rice in the 1700's, Technical Analysts use Candlestick-based charts to gauge the trend of a stock's price, and to decide whether to buy, sell or continue to hold onto a stock.
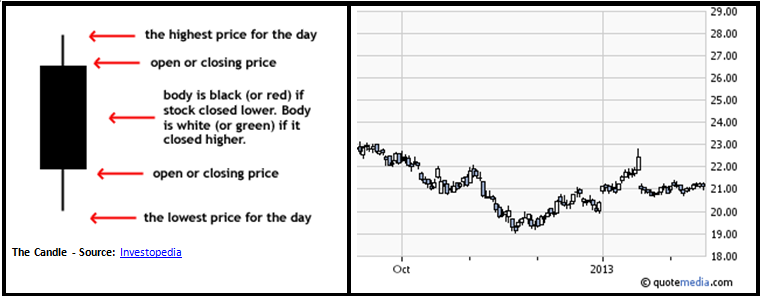
The Candle – Source: Investopedia
Daily movements of a stock's price are charted on a graph using a "candle" symbol. While each point on the graph reflects a single set of data for the day, the "candle" itself contains 5 important sets of information that a stock trader can use to determine whether he/she should enter a trade or exit it.
[related1][/related1]
Other commonly used tools used by Technical Analysts include:
- Stochastic indicators: These help an analyst understand the link between a stock's closing price and its price over a specified window of time. George Lane, who developed this technique, is called the "Father of Stochastics", and used "14" as the basis for his analytical model. The "14" in the model can refer to several types of periods, including days, weeks or months, over which the analysis is conducted.
- Fibonacci Lines: This technique is based on the model developed by Lenardo Fibonacci, the famous 12th century Italian mathematician. It plots a sequence of stock prices on a graph, where each point on the graph represents the sum of the previous two prices. For instance: $1, $1, $ 2, $ 3, $5, $8, $13, $21, $34, $55, etc. This technique is grounded in the mathematical fact that any given value in the Fibonacci series is approximately 1.618 times the value of its predecessor. Technical Analysts use this knowledge to predict changes in stock price trends.
So what's technically wrong with Technical Analysis?
Nothing! That's according to Technical Analysts. However, there is a third school of thought (in addition to Fundamental and Technical Analysts) known as the Efficient Market Hypothesis (EMH), that completely disagree with both Technical Analysts and Fundamental Analysts. According to EMA believers, the market always efficiently prices stocks, therefore leaving no room for Technical or Fundamental factors to influence them.
Since the market is efficient and intelligent enough to self correct, trying to beat the market at its own game based on any form of analysis is next to impossible, say followers of EMA. That's because any excess returns that investors harvest through tools such as Technical or Fundamental analysis will, in the long term, be eroded by actions of other investors participating in market activities.
Final thoughts
Successful investors are those that use any well regarded means available to guide them into making intelligent investment decisions. That means using both Fundamental data as well as Technical signs to decide whether or not a stock poses a good investment opportunity. Usually, long-term (Buy & Hold) investment decisions should be based on sound fundamentals. Trading decisions on the other hand do well from using technical signs that indicate when to hop into and out of a trade.
(By: Monty R. – MarketConsensus News Contributor)
[related2][/related2]