Valuation and Fundamental Analysis for Comcast Stock
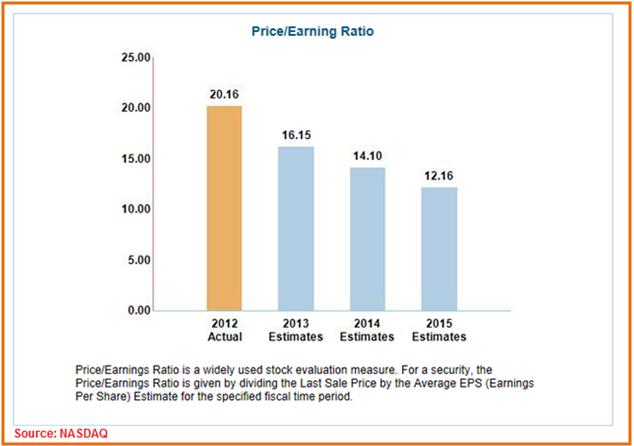
Over the next 3 years, as seen in the chart below, stock analysts expect Comcast stock to become increasingly cheaper, on a Price/Earnings Ratio (PE) basis. In 2012, the stock traded at a PE multiple of 20.16x, which is estimated to gradually decline to 12.16x by 2015.
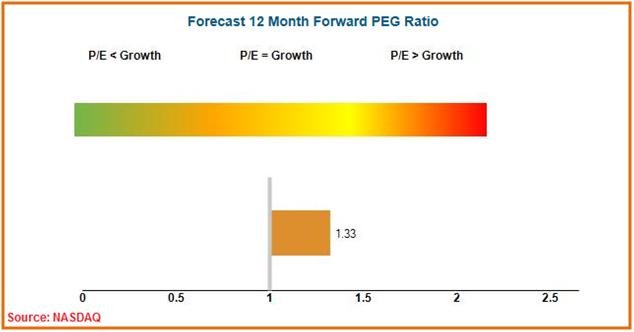
Forward Price/Earnings Growth (F-PEG) Ratio: Comcast currently has a F-PEG Ratio of 1.33, which is based on forward earnings for the next 12 months (up to May 2014), suggesting the stock may be slightly overvalued. A lower PEG would give investors the confidence that they are paying a relatively low value for future earnings.
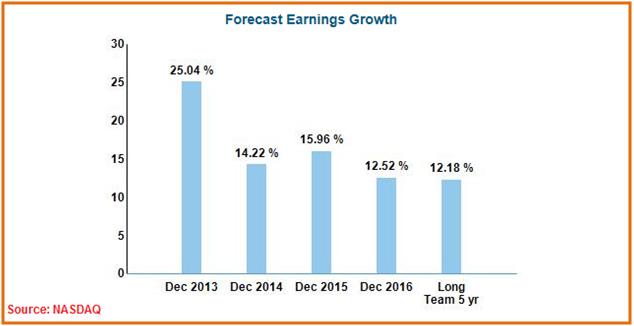
Earnings Growth Forecast: CMCSA currently has an impressive full year 2013 earnings growth forecast of 25.04%, which is far better than both of its two peers being reviewed in this analysis (DISH: -16.73%; DTV: 7.71%). On a longer term basis (5-years), CMCSA's earnings growth is expected to taper off to 12.18%, which trails the growth expectation of DTV (12.42%) slightly.
Technical Perspective
Since our last analysis of CMCSA, we can see that some of the technicals for the stock have deteriorated. However, some of these technical breakdowns do not necessarily reflect weakness in the stock itself, but could be indicative of a broader market correction.
See Also: Is Nokia Stock a Buy or Sell? NOK Stock 2013 Valuation Analysis
Looking at how the stock has performed over a 3-month period, we can see that in late May 2013, the stock broke through support levels at its 30-day and 60-day Simple Moving Average (SMA). At the time of this review, the stock is trading at $39.56, which is around $4 shy of its 52-week range high of $43.74.
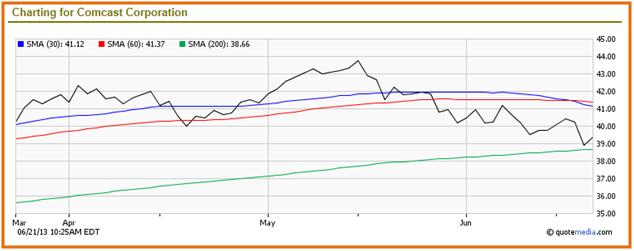
The stock has closed down for 6 of the last 10 trading sessions, losing $1.04 (or roughly 2.55% based on current price) from its $40.67 close at end of day on June 10, 2013. Interestingly, while the stock has broken through resistance at 30 and 60 day SMA's, it seems to be finding support slightly above its 200-day SMA, and (as indicated in the chart above) seems to be showing a slight upward trend.
Investors should watch to see if the stock can break through resistance at the $41.12 and then $41.37 levels. Should that happen, we could see the stock climb higher and form new 52-week highs in a short time.
[related1][/related1]