(Continuing from "Is Intel Stock (INTC) a Buy, Sell or Hold? INTC Financial Analysis")
- INTC Valuation Analysis
Investors should pay attention to price-based multiples when evaluating a company as a potential investment opportunity. Price multiples indicate the price you pay for a specific metric. For instance, valuation of ARM (Intel's rival) on a Price/Sales basis (see graph below) indicates that shareholders are paying roughly $23.14 for a single dollar of sales. In INTC's case, you pay only $2.047 for one dollar of sale.
Intel carries a Total Debt of $13.45B, and ended Q4-2012 with a Total Cash balance of $18.6B, which translated to around $3.66 of cash on a Per Share basis. According to Morningstar, INTC has a Debt/Equity ratio of 0.1, which compares significantly better than AMD's 2.1, and the industry average of 0.3. However, with a Debt/Equity ratio of 0.0, rival ARMH fares much better.
INTC Price/Sales Ratio Vs Competitors
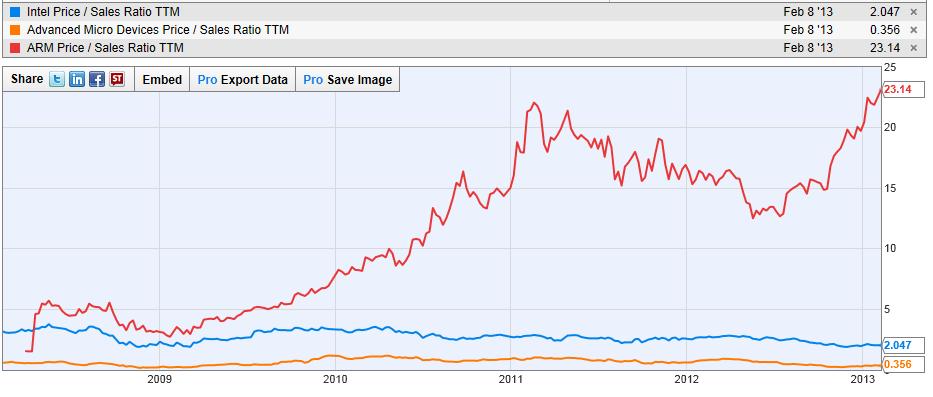
Source: YCharts
The table below summarizes some other key price valuation metrics for INTC and its competitors. On both a Price/Earnings (how much you are paying for a dollar of Earnings) and Price/Book value (how much you are paying for a dollar of Net Assets) basis, INTC fares better than its main rival ARMH and the Industry, as its shareholders pay relatively less for a dollar of either metric.
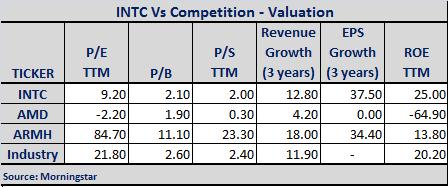
Morningstar data also indicates that on a 3-year average Revenue Growth as well as EPS Growth basis, INTC stacks up fairly well against its main rivals and the industry as a whole. On a ROE-basis however, INTC management has done better than its rivals and the industry in returning value to its shareholders.
- Technical Perspective
Over the past 52-weeks, INTC has traded in a price range between $19.23 and $29.27. While the stock has been trading below its 50-day Simple Moving Average (SMA) for most of the past 6 months, it seems to have breached that resistance and has been trading above that level ($20.70) for most of 2013.
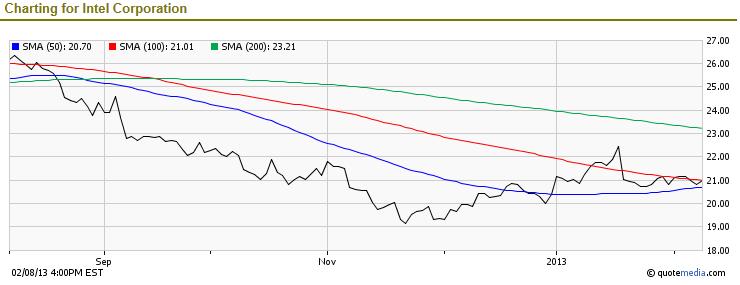
However, the stock seems to have trouble breaching, and staying above, its 100-day SMA ($21.01), although it has been following that resistance level fairly closely over the last several trading sessions. From the graph above, it would seem as though the stock is building a base at these levels, which is a positive technical sign. Barring some catastrophic event, this base-building should set the stock up for an uptrend. However, breaching the 200-day SMA of $23.21 may not happen in the short-term.
Continue (Series 3 of 3): Favorable Catalysts for Intel (INTC): Growth in Sales & Operating Income