Yahoo! Stock Rises
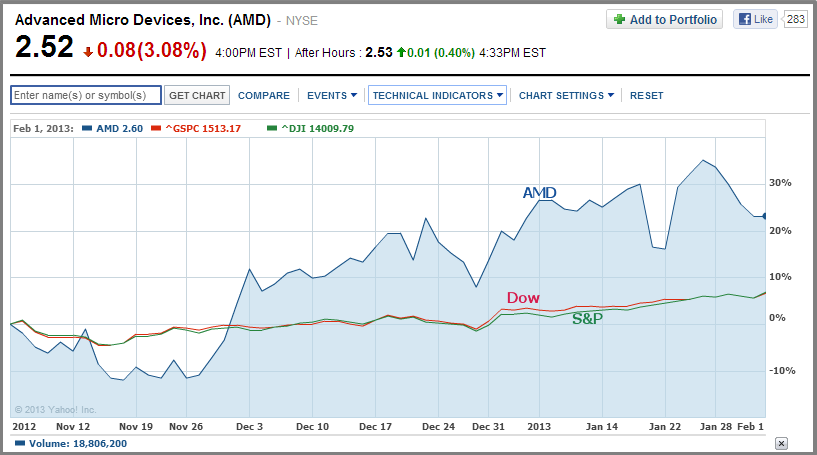
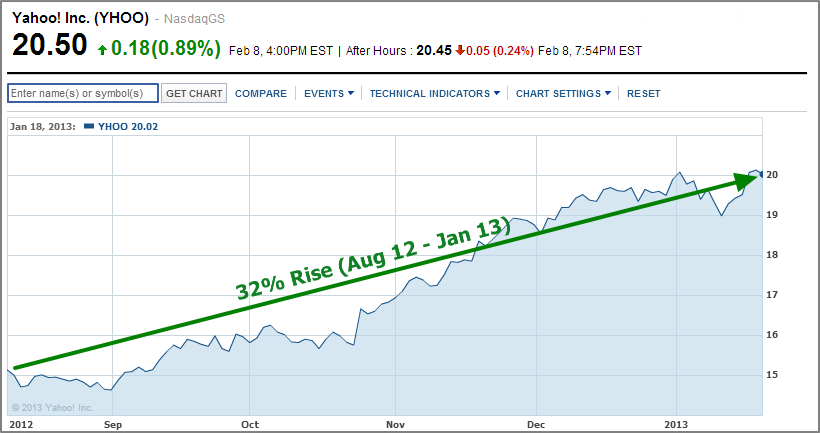
Since August of 2012, Yahoo!'s stock price has risen by 32%, leaving a lot of investors to question whether the stock is a good buy, sell, hold or even short. Some analysts however believe that breaking up the company is the best remedy. They argue that splitting up Yahoo! will unlock further value for its shareholders.
Let’s assess the various facts and try to address the multiple view points.
Yahoo! (YHOO) Analysis Breakdown – Is the Stock a Buy, Sell or Hold?
- Fundamental Analysis
- Valuation Overview
- Technical Perspective
- Bottom Line Conclusion
Fundamental Analysis
The industry average for Earnings Per Share (EPS) in the IT Services & Consulting industry, of which YHOO is a part, is $10.42. While its latest EPS was 302.88% higher than it was the previous year, the company only reported an EPS of $3.30, which is significantly lower than the industry.
While the industry in general has showed signs of positive revenue growth, Yahoo! has been gradually losing market share, which has contributed to the decline in its revenues. Year over year revenue growth, for the quarter ending 09/2012, was a disappointing -4.2%.
Shareholders might take some comfort in the profitability of the company though (compared to the industry in general) with a Gross Margin of 67.71% (58.01%), Operating Margin of 12.46% (-52.99%) and Profit Margin of 66.94% (-52.01%). Management also appears to be relatively more effective (than industry peers), with Return on Assets of 19.02% (6.10%) and Return on Investment of 22.05% (15.76%).
In plain terms, what all these numbers mean is that, while Yahoo! is definitely facing an erosion in its market share, management seems to be doing an exceptionally good job managing the company's fortunes under the given circumstances.
[newsletter2][/newsletter2]
Valuation Overview – Where is the Value?
YHOO currently trades at a Forward P/E of 17.4, with its 5-year average of this valuation standing at 28.9. This would mean the stock trades at a 40% discount to its historical Forward P/E multiple. The stock trades at a Trailing P/E of 5.9 times, with 5-year average of this measure standing at 31.2. Relative to the 5-year average, this would mean YHOO trades at a 81% discount today. Finally, based on a current Forward PEG value of 1.6, and a 5-year F/PEG average of 2.1, the stock trades at a historical discount of around 25%.
When weighing a stock's value, investors will do well to look at a benchmark – which in this case could be represented by the S&P 500. On all of the 3 valuation metrics above, YHOO trades at a discount to the benchmark, which supports a F/PE of 17.5 (0.60% discount), a T/PE of 23.2 (discount of 75%), and a F/PEG of 1.8 (discount of 13%).
In plain speak, what this means is that Yahoo! appears to be very cheaply priced on a relative valuation basis.
Technically speaking
At the time of this writing, YHOO has been trading in a 52-week range of between $14.35 and $20.32 according to Morningstar data. The stock hit new lows in 2008 and has struggled to break above its 30-day Simple Moving Average (SMA) resistance price of $16.02 ever since. It did break through that resistance level briefly, in the second half of 2010, but dropped back down a few months later.
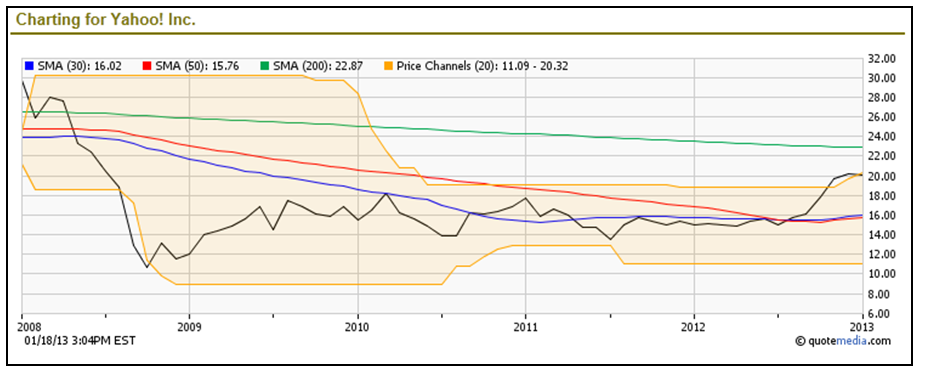
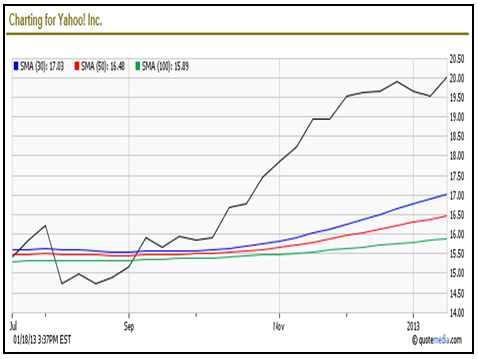
An interesting technical move occurred sometime in mid Oct 2012, corresponding to its Q3-2012 earnings reporting, when the stock rallied to not only break through its 30-day SMA but also its 50-day SMA ($15.76). YHOO has traded above those 2 milestones ever since, largely on an upward momentum. When viewed on a 6-month basis though, the stock seems to have mounted a spectacular recovery, trading well above its 30-day ($17.03), 50-day ($16.48) and 100-day ($15.89) moving averages.
Some of that momentum might be attributed to its Q3-2012 results, released on Oct 22 2012, as well as built-in anticipation around the next set of results due sometime in late Jan/early Feb 2013. However, some stock watchers might be inclined to also attribute some of this dramatic rise to a series of acquisitions that YHOO performed, starting from late Dec 2011, when it acquired Interclick, followed by Stamped, a mobile recommendations start-up in Oct 2012, and finally OnTheAir, a start-up video chat company, in early Dec 2012.
The rising share prices since Oct 2012 could be an indication that investors are expecting these acquisitions to be highly accretive for YHOO, and are expecting these new entrants into the Yahoo! family to start contributing to the company's bottom line sooner, rather than later. Regardless of what triggered this upswing, technical analysts might agree that the stock is definitely showing signs of a much needed, long awaited recovery.
Closing Arguments
The relatively recent stock price surge aside, shareholders haven't had much to cheer about their holdings in YHOO. However, just like the breaking up with Alibaba yielded over $6.3B in cash for Yahoo!, most of which should, in some form, trickle down back to shareholders, perhaps another breakup might be well advised to unlock even more shareholder value. A good start might be to consider putting Yahoo!'s Japanese subsidiary on the chopping block.
[related2][/related2]