MU Fundamental Valuation Analysis – Is Micron Technology (MU) Stock a Buy, Sell or Hold?
Anyone with a passing interest in the Tablet, PC and Smartphone sector will know about the "wars" – competition wars, marketing wars, price wars, product launch wars, innovation wars – that are going on in that sector.
However, what might be less known is the impact these wars are having on Semiconductor/Chip manufacturers like Micron Technology Inc (MU) and competitors like NXP Semiconductors NV (NXPI) and Intel Corporation (INTC), who are themselves warring for business from giants like Apple, Samsung, Dell and Microsoft.
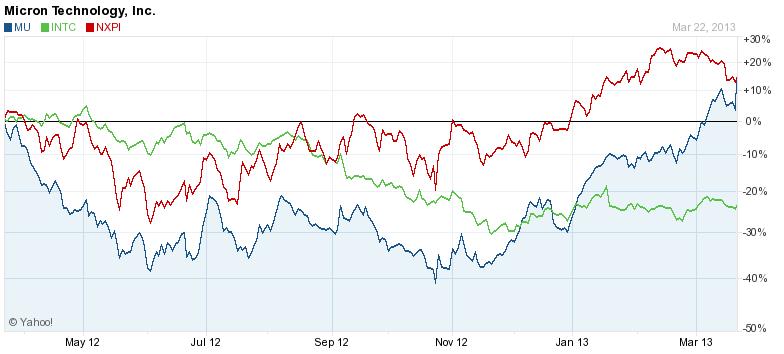
Based on the stock price chart above, it is clear that Micron Technology’s shares are in an upward trend, while both of its competitors seem to be either losing momentum (NXPI) or moving sideways (INTC).
Shareholders and potential investors of Micron Technology may be interested in knowing what the future holds for their investment, and whether MU stock rates as a buy, hold or sell?
Let's review some of the key stock fundamental and technical data for Micron Technology that might help answer whether MU stock is a good buy or sell in 2013.
Micron Technology (MU) Stock Valuation Analysis Report
- MU’s Fundamental Analysis
- MU’s Valuation Overview
- Micron Technology (MU) Stock Technical Analysis
- Favorable/ Negative Catalysts Impacting MU Stock
- Bottom Line Conclusion on MU
- Market Correction Impact
- Micron Technology (MU) Fundamental Analysis
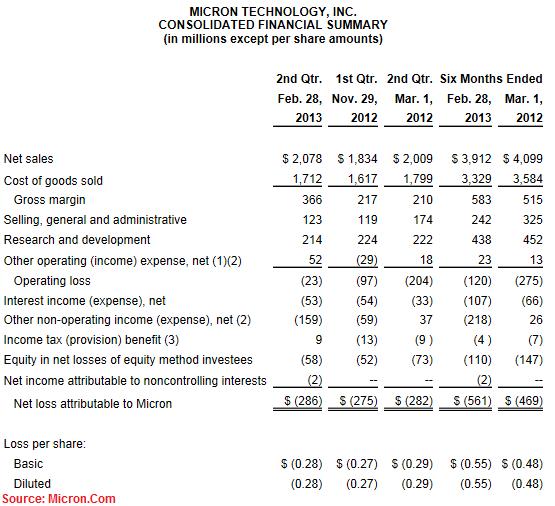
On March 21 2013, Micron reported results for its second quarter of fiscal 2013 (period ending February 28th 2013). Q2-2013 results disclosed a net loss of $286M based on Net Sales of $2.1B. That translated to a net loss per diluted share of $0.28. These results come in the wake of a Q1-2013 net loss of $275M on $1.8B of net sales (or $0.27/diluted share). On a same-quarter basis, MU had reported a net loss of $282M (or $0.29/diluted share) on net sales of $2.0B in Q1-2012.
The results reported were not necessarily all doom and gloom. A bright spot for shareholders is that the company reported significant improvement in Gross Margins, from 12% in Q1-2013 to 18% in the most recent quarter. More encouragingly for shareholders to note is the fact that these improved margins were applicable to both NAND Flash as well as DRAM product line, and were attributable to decreasing costs of manufacturing.
Another ray of sunshine in the loss-making quarter was related to Sales revenue. DRAM product sales revenues in Q2-2013 were up by 24% over Q1-2013, mainly on the back of a 38% jump in volume. However, the company did admit to an approximate 10% reduction in average sale price. Similarly, Q2-2013 saw an 8% improvement on NAND Flash products over Q1, with an encouraging 13% volume improvement. The only damp spot was the NOR Flash product line, which saw a 14% decline in revenues compared to last quarter.
Overall, investors liked what they heard on March 21 as the stock was handsomely rewarded, closing at $10.04 on March 22 – up by 10.69% from its Mar 21 closing price of $9.07. The average 10-day trading volume for the stock, up to and including the day the results were reported, was 35,019,549 shares. However, the day following the result announcement 99,677,962 shares changed hands – a spike of over 180% of the 10-day average volume! Yet another sign of investor confidence in the earnings announcement.
- Micron Technology (MU) Valuation Overview
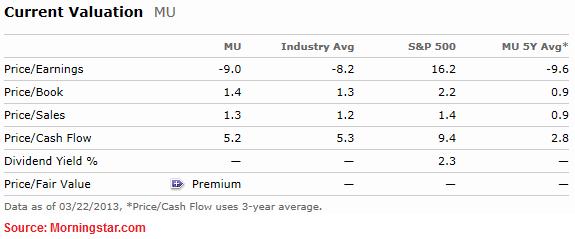
Based on Morningstar data, MU's current valuation appears to be generally in line with the average valuation for the Technology and Semiconductor Sector/Industry. On a Price/Earnings basis, MU (-9.0x) is valued at a slight discount to the Industry average (-8.2x). However, the company is trading at a significant discount when compared against the S&P 500 average P/E of 16.2x.
MU's Price/Book valuation (1.4x) is almost in line with the Industry average (1.3x), and not too divergent from the S&P 500 average of 2.2x. On a Price/Sales and Price to Cash Flow basis too (1.3x and 5.2x respectively), the company measures well and trades in line with the Industry (1.2x and 5.3x) and the S&P 500 (1.4x Sales), although it does trade at a significant P/CF discount to its S&P 500 index peers (9.4x Cash Flow).
While not an apples-to-apples comparison with MU (Market cap of approximately $10B), another player in the Semiconductor industry, Intel Corp (INTC) (Market cap of approximately $100B), trades at a valuation of 10.0x Price/Earnings, while NXP Semicondustor NV (NXPI) trades at a discounted P/E valuation of -64.9x but a premium of 10.3x Cash Flow.
Overall we could summarize that, at current prices, MU is a relatively (to the Industry and S&P 500) and comparatively (to some of its peers) fairly valued stock.
Continue: MU Stock Surges 72%. Technical Stock Analysis and Favorable Catalysts
(By: Monty R. – MarketConsensus News Contributor)
Good luck in your investing. Let us know if you have any questions, comments or feedback,
MarketConsensus Stock Analysis Team
Stay in Touch:
Facebook (Like Us on Facebook)
Twitter (Follow Us on Twitter)
Google + (Connect with Us on Google+)
Contact Us (Questions/Comments)
————————————————————————————————-
[related2][/related2]


