- Vodafone (VOD) Valuation Overview
(Continuing from previous article: Is Vodafone Stock (VOD) a Good Buy, Sell or Hold in 2013?)
When determining the value of a stock, investors normally consider some distinct variables as part of their valuation analysis. These include a company’s financial margins, management effectiveness, growth rates, return on investments, financial statement analysis (Income, Balance Sheet & Cash Flow Statements) and other valuation matrix (EPS, P/E, Debt Ratio, Etc.)
Vodafone has a debt to total capital ratio of 33.51%, which is in-line with the Communications Services industry. It has a Quick Ratio that is less than 1 (Quick Ratio is an "acid test" or "quick test" used by investors to determine a firm's ability to pay its short-term obligations with available cash – in the absence of any income. This is important as a company needs to be capable of paying its immediate obligations, not just in good times, but also in times of financial, operational or economic stress.
VOD’s Quick Ratio of 0.72 (total cash/total short term debt) means that the firm only has 72 cents of available cash for each dollar of short term debt. There are not enough liquid assets to satisfy current liabilities in the event that operating earnings are unable to.
The firm’s quarterly revenue growth is declining at a year over year rate of -7.40% (as of 2/7/2013). For the past 12 months, it shows a Return on Equity (ROE) of -1.96%. It, however, offers a positive Return on Assets (ROA) of 2.70%. ROE and ROA are variables used by investors to determine management effectiveness. For each $1 of equity, VOD’s management is losing $0.0196 and for each $1 of asset, management is earning a low return of $0.0270.
EPS: VOD shows a negative EPS growth (last 12 months) of -125.06% compared to the industry average of -49.68%.
Profitability: Although the firm has a negative Profit Margin (last 12 months) of -3.80%, it was able to realize a positive Operating Margin (last 12 months) of 13.44%.
Income: Over the last twelve months, the firm has been able to generate revenue of 71.81 billion.
Overall, VOD presents an “average” financial and operational valuation, which could be the major factor causing the stock to trade within a tight bandwidth. In order for the stock to break out, investors need to see significant improvements (stock breaks upward) or further deterioration (stock breaks downward).
- High Dividend Yield
Vodafone is offering investors one of the highest yields available. With a dividend yield of 5.70% VOD stock remains very attractive to a lot of investors, who invest in the stock primarily to earn an annual income of 5.70%. This is better than the return offered by most CDs or high yield accounts.
- Trading Strategy for Investors
Based on the stock’s trading range, investors can implement “short term” buy and sell trading strategies to take advantage of the stocks’ two year $25-$30 bandwidth (Nasdaq) and 154.4-191.2 pence bandwidth (LSE).
VOD – Nasdaq Exchange (Feb 2011 – Feb 2013)
Trading Range: $25 (Low) – $30 (High)
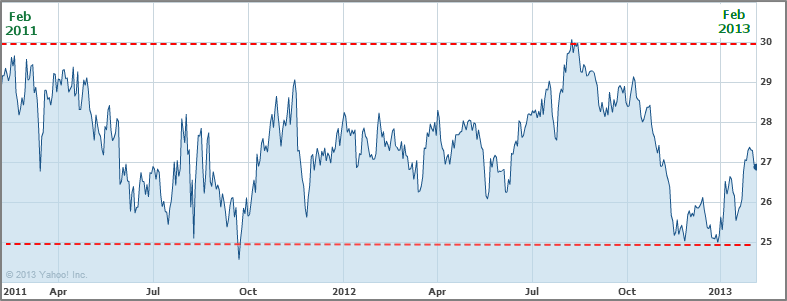
Source: Yahoo! Finance
VOD – LSE (Feb 2011 – Feb 2013)
Trading Range: 154.4 (Low) – 191.2 (High)
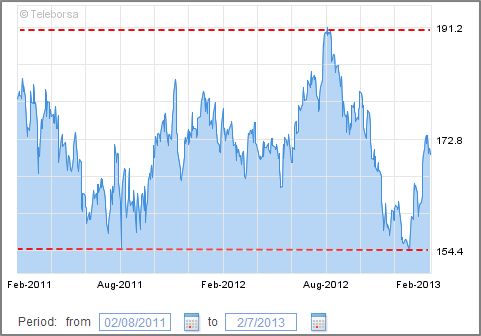
Source: LSE
Such a trading strategy can involve buying the stock when it drops close to the lower band and then selling/shorting the stock when it gets close to its higher band level. However, just as in all forms of investing, there are risks to every strategy and we strongly recommend that investors consult with an independent financial advisor regarding their decision to invest or trade in a stock.
- Market Correction Impact
MarketConsensus would, however, like to caution investors on what we see as an imminent market correction. Market trend indicators are pointing to an overbought situation and a correction is a very real risk over the next 1-3 months. Investors should take this into consideration in their near term investing choices.
[related2][/related2]