Can Alcoa Prove its Metal? Is the stock (AA) a Good Buy or Sell?
Over the last few years, the Aluminum industry has been facing some stiff challenges. In the backdrop of the European crises, and with persistent worries about an economic slowdown in China, the price of Aluminum has seen a steady decline. As the chart below shows, from a high of around $2,500 a ton in Feb 2011, the price of this versatile metal has plunged to $2,038 a ton today, marking a downward spiral of nearly 18%.
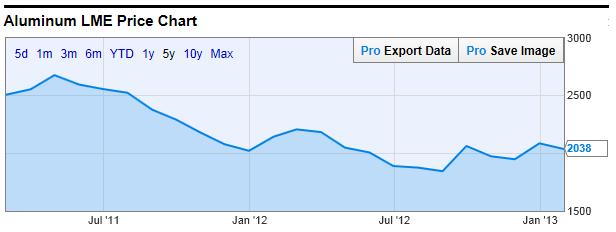
Historical Aluminum Prices – Source: YCharts
Investors looking to invest in Alumina producers and the Aluminum industry in general are faced with very tough decisions. As the chart below indicates, the share prices of Alcoa Inc (NYSE:AA) and its peers have been following each other in lock-step, in tandem with the price of Aluminum.
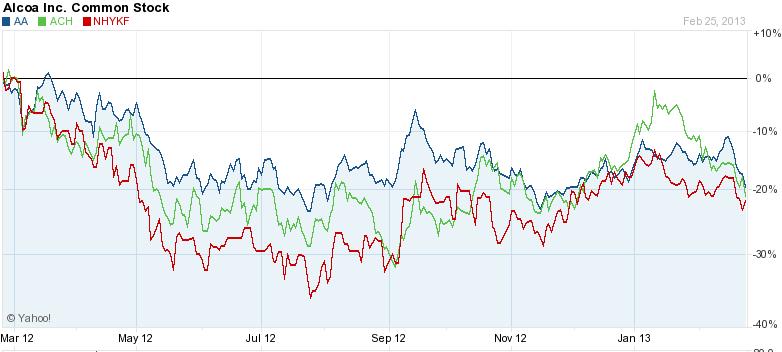
Alcoa Share Price Vs. Competitors – Source: Yahoo Finance
The question is: Given this dynamic, and a nearly 17.5% decline in its stock price from a year ago, can AA stage a comeback, and is it a Buy, Sell or Hold? Let's review some of the facts to shed light on these questions.
Alcoa Inc (NYSE: AA) Analysis Breakdown
- Fundamental Analysis
- Valuation Overview
- Technical Perspective
- Favorable Catalysts for the Stock
- Bottom Line Conclusion
- Market Correction Impact
- Fundamental Analysis
For its 4th quarter, AA saw net income grow from a negative -$191 in Q4.2011 to a positive $242M in Q4.2012. That's a significant increase of almost 227% on a same-quarter y/y basis, and an almost 270% increase sequentially over Q3.2012. This staggering increase in net income comes despite an almost 1.5% drop in revenue from the same quarter of last year.
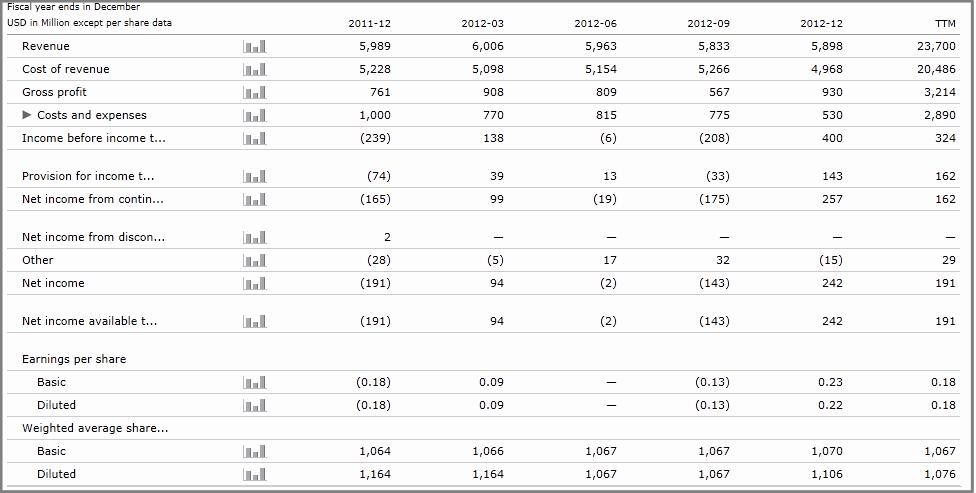
Alcoa Quarterly Results: Source: Morningstar
Over the last 3 years however, AA's annual Earnings Per Share (EPS) has been rather erratic at $0.24, $0.55 and $0.18 for the years 2010, 2011 and 2012 respectively. Coming in at $933M, the company has seen a significant decline (approximately 18.3%) in its Net Operating Cash Flow on a same quarter last year basis. One bright spot though may be the fact that the company has managed to control and cut its Cost of Revenue by 47% and 31.5% when compared to same quarter last year and Q3.2012 respectively. This could indicate management's acknowledgement of the seriousness of its cash flow situation.
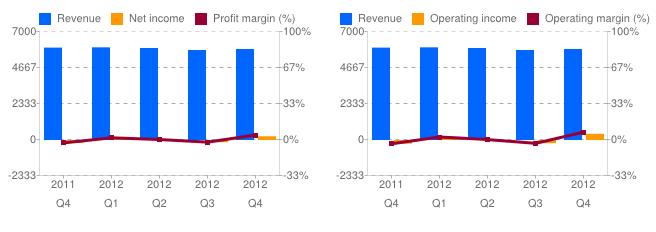
Alcoa Margins – Source: Google Finance
Shareholders may not be overly impressed either by AA's Profit margins or its Operating margins over the course of the last 12 months. While both metrics have registered some slight degree of improvement over the last sequential quarter, these improvements might be more a factor of cost cutting than any dramatic increase in revenue. According to Morningstar analysis, AA has a TTM Operating Margin of 2.0% and a TTM Net Margin of 0.8%, compared to Industry averages of 4.9% and 1.6% respectively. With a TTM Return On Equity (ROE) of 1.4, compared to the Industry average of 3.3, shareholders would be prudent to question what value AA's management is delivering to them.
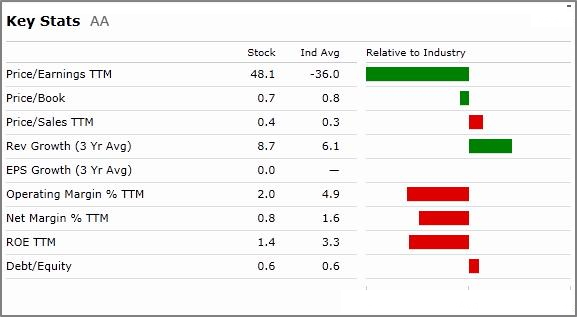
For 2013, the company predicts an approximately 7% growth in the demand for Aluminum, primarily driven by predictions of strong demand from the aerospace industry as well as growth expectations from China. On a positive note, Morningstar analysts see AA's 3 year Average Revenue Growth at 8.7, which is higher than the Industry average of 6.1. Future revenue growth will however depend largely upon improving global macro economic conditions, and the company's ability to command higher prices for its Alumina and Aluminium products.
- Valuation Overview
AA is currently trading at a TTM P/E multiple of 48.1, which is a significant premium to the Industry average of -36.0. When valued on a Price/Book and TTM Price/sales basis, AA compares relatively favorably (0.7 and 0.4 respectively) or in line with the Industry averages of 0.8 and 0.3 respectively.
On a TTM Price/Earnings basis, AA is trading significantly higher than both of its competitors. However, on a TTM Price/Sales basis, AA's valuation seems to be more attractive than NHYKF, but is only marginally higher than that of ACH, which shows a significantly higher 3 Year Average Revenue Growth to the Industry and its competition. Revenues for the entire sector will of course hinge on higher demand, which Forbes has quoted Moody's as "…not expected to show significant recovery over the next several quarters". Until demand picks up therefore, AA's valuation at these levels may not seem attractive to potential investors.
When viewing these valuations, shareholders will do well to keep in mind that AA and NHYKF have roughly the same level of Market Cap ($9B and $9.7B compared to $5.8B for ACH) yet, at 0.1, NHYKF has a much more favorable Debt/Equity ratio to that of AA's 0.6. On purely a valuation basis therefore, keeping all other fundamental and technical factors aside, AA may not justify the huge P/E multiples that it is trading at.
Continue: Alcoa Stock (AA) – Technical Analysis & Favorable Catalysts
[related2][/related2]